General Modeling Information
- General Modeling Information
- Overview
- CRMMS 24-Month Study Mode
- CRMMS Ensemble Mode
- CRSS
- Hydrology
- Policy
- Uncertainty
- Modeling Assumptions
Overview
Reclamation’s Upper and Lower Colorado Basin Regions use a suite of models for annual, mid-, and long-term planning. The Colorado River Mid-term Modeling System (CRMMS) and the Colorado River Simulation System (CRSS) are basin-wide models of the Colorado River system implemented in the commercial river modeling software called RiverWareTM developed by the Center for Advanced Decision Support for Water and Environmental Systems (CADSWES) at the University of Colorado Boulder. The models are updated and maintained continually by Reclamation’s Upper and Lower Colorado Basin Regions. This page provides an overview of the models, describes the approach to each type of projection, summarizes the hydrology types and policies represented in the models, describes sources of uncertainty, and compares the key modeling assumptions.
The two basin-wide models simulate the operation of the major reservoirs on the Colorado River system and provide information regarding the projected future state of the system on a monthly basis. Output variables include the volume of water in storage, reservoir elevations, releases from the dams, energy generation, streamflow, and diversions to and return flows from water users throughout the system. These simulations use a mass balance (or water budget) calculation, which accounts for all water entering, stored in, and leaving the system. Both models contain modeling “rule sets”, which simulate how water is released and delivered under various hydrologic conditions with the aim of simulating actual operations.
CRMMS is used to produce the 24-Month Study and the 2-Year and 5-Year Probabilistic Projections. For 24-Month Study projections, CRMMS is run in 24-Month Study Mode, which uses a single “Most Probable” unregulated inflow forecast to inform basin-wide conditions over the next two years. The 24-Month Study is published monthly to provide regular updates on basin conditions for operations and planning purposes. The August 24-Month Study is used in Reclamation’s Annual Operating Plan and sets the operating tiers for the coordinated operation of Lake Powell and Lake Mead for the following year.
In addition to running the Most Probable 24-Month Study, Probable Minimum and Probable Maximum forecast traces are run through the CRMMS in 24-Month Study Mode four times per year. Since the Upper Basin Drought Response Operations Agreement (DROA) was triggered in January 2021, the Probable Minimum and Probable Maximum inflow scenarios have been run more frequently. Currently, the Probable Minimum scenario is being run every month. More information about the approach to these projections can be found in the CRMMS 24-Month Study Mode tab.
For the 2-Year and 5-Year Probabilistic Projections, CRMMS is run in Ensemble Mode to provide more information about risk and uncertainty for operations within a one- to five-year planning horizon. CRMMS Ensemble Mode uses an ensemble of unregulated streamflow forecasts developed by the National Weather Service Colorado Basin River Forecasting Center (CBRFC) using Ensemble Streamflow Prediction (ESP) forecasts. More information about the approach to these projections can be found in the CRMMS Ensemble Mode tab.
For outlooks beyond five years, Reclamation uses CRSS. CRSS is a long-term planning model that projects basin-wide conditions over a period of years to decades into the future and is typically used for long-term studies, policy exploration, scenario comparisons, and supplementary resource analyses. Before February 2022, CRSS was also used to generate 5-Year Probabilistic Projections. More information about CRSS and the approach to these projections can be found in the CRSS tab.
There are several distinct differences between the projections, one of which is the type of input hydrology. CRMMS uses unregulated inflow forecasts, while CRSS uses historical natural flow as the hydrologic input. While CRMMS in 24-Month Study Mode simulates the projected conditions based on a single Most Probable inflow forecast, CRMMS Ensemble Mode and CRSS simulate a range of hydrologic futures to account for future hydrologic uncertainty. Reservoir operations are also simulated differently. Reservoir operations are manually input in CRMMS 24-Month Study Mode but are solved for by rule-based logic in CRMMS Ensemble Mode and CRSS. For a comparison of the models and projections, see the Modeling Assumptions tab.
CRMMS 24-Month Study Mode
The 24-Month Study projects future conditions in the Colorado River system extending out 24 months from the run month using a single trace of hydrology. The projections are updated every month, typically by the 15th day of the month, to provide regular updates on basin conditions for operations and planning purposes. The 24-Month Study is run using the Colorado River Mid-term Modeling System (CRMMS) in “24-Month Study Mode.” The system conditions are simulated using a single hydrologic trace, known as the Most Probable unregulated inflow forecast, which is informed by the National Weather Service Colorado Basin River Forecasting Center (CBRFC) forecast. In January, April, August, and October, the Probable Minimum and Probable Maximum inflow scenarios are run through the 24-Month Study. When the Drought Response Operations Agreement (DROA) is triggered, all three inflow scenarios are run more frequently.
Model and Policy
CRMMS is implemented in RiverWareTM, a software developed and maintained by the Center for Advanced Decision Support for Water and Environmental Systems (CADSWES) at the University of Colorado Boulder. The model simulates monthly operations at twelve reservoirs (nine in the Upper Basin and three in the Lower Basin). Operations for these reservoirs are manually input by Reclamation’s reservoir operations groups in the 24-Month Study. These operations are consistent with the various records of decisions, laws, and minutes that define Colorado River Basin operations. More information can be found in the Policy tab.
Hydrology
The 24-Month Study has twelve hydrologic inflow points in the Upper Basin, and seven in the Lower Basin. The Upper Basin forecast locations are unregulated inflows, which are gaged flows adjusted for the effects of upstream reservoirs but not depletions, with the exception of the Gunnison Tunnel, Azotea Tunnel, and Navajo Indian Irrigation Project diversions. A description of unregulated flows and the historical unregulated Lake Powell inflow record are found in the Hydrology. The Lower Basin flows are intervening flows, which are the amount of flow entering the system between an upstream and downstream point.
The 24-Month Study uses unregulated streamflow forecasts provided by the CBRFC. The CBRFC generates these forecasts using a technique known as Ensemble Streamflow Prediction (ESP). This technique generates multiple time series, i.e. traces, of forecasted streamflow. Forecasts are created using the Sacramento Soil Moisture Accounting hydrologic model, which is initialized with current basin conditions for soil moisture and snowpack and forced with a set of historical time series of precipitation and temperature that matches the model calibration period (currently 1991 through 2020). A depiction of this process is shown below.
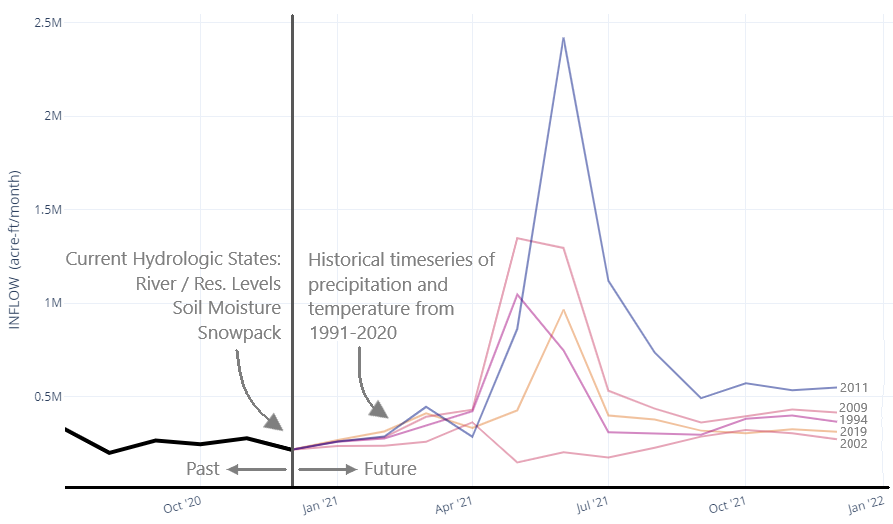
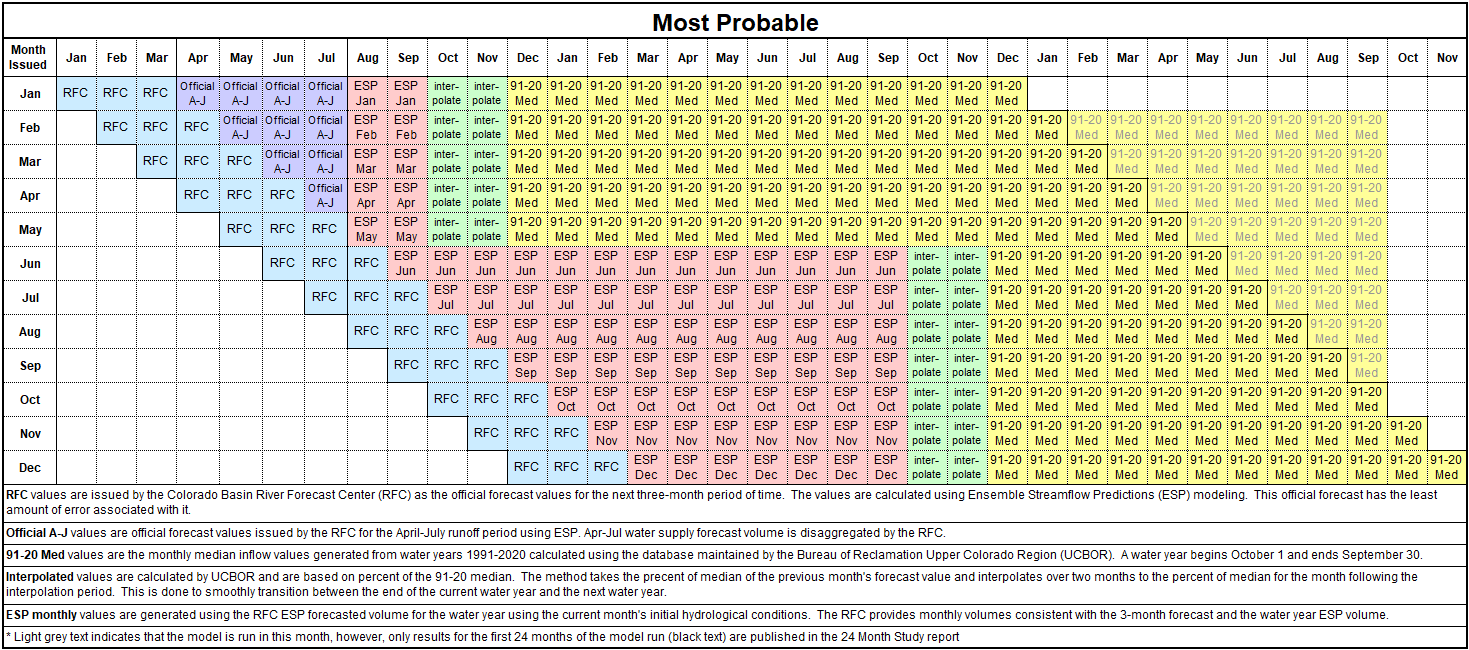
CBRFC forecasters use ESP to develop the official unregulated inflow forecast that is used by Reclamation to develop the hydrologic trace for the Most Probable, Probable Minimum, and Probable Maximum 24-Month Studies. The Most Probable trace is a combination of official CBRFC forecasts, median ESP forecasts, and median historical flows from 1991-2020 (i.e., climatology), as shown in the matrix below. Hydrology in the first water year uses a single monthly unregulated inflow trace for each Upper Basin inflow point. When forecasts are made early in the water year (October to May), Year 2 and beyond (“out-year”) inflows are comprised of the climatology, with two months of interpolation. For forecasts made later in the water year (June to September), the out-year inflows are the median ESP forecast through the end of the second water year after which climatology is used. The matrix showing how the Most Probable forecast trace is developed is shown below.
The Probable Minimum and Maximum unregulated inflow traces are created similarly to the Most Probable trace. These traces are typically run four times per year, though recently they have been run every month as required by DROA. The Probable Minimum inflow scenario reflects a dry hydrologic condition, while the Probable Maximum reflects a wet hydrologic condition. The matrices for how the forecast traces are developed are shown in the figures below.
For the January Probable Minimum (Maximum) trace, the CBRFC official forecast is used for the first three months (January through March), after which the CBRFC official April through July 10th (90th) percentile forecast is appended. The April Probable Minimum (Maximum) traces also use the April through July 10th (90th) percentile forecast. For both the January and April Probable Minimum (Maximum) traces, the remaining months of the first water year (August and September) are used as an interpolation period from the April through July forecast to the 25th (75th) percentile of the climatological period (1991-2020), which are used with the remaining months of the second water year. For the third water year, the 50th percentile (median) flows are used as the Probable Minimum and Maximum traces. For the August and October Probable Minimum (Maximum) trace, the CBRFC official forecasts are used for the first three months of the forecast, followed by 10th (90th) percentile ESP forecast for the remainder of the water year. The following water year uses the 25th (75th) percentile of the climatological record, with the first two months of the water year used to interpolate between the two hydrology types.
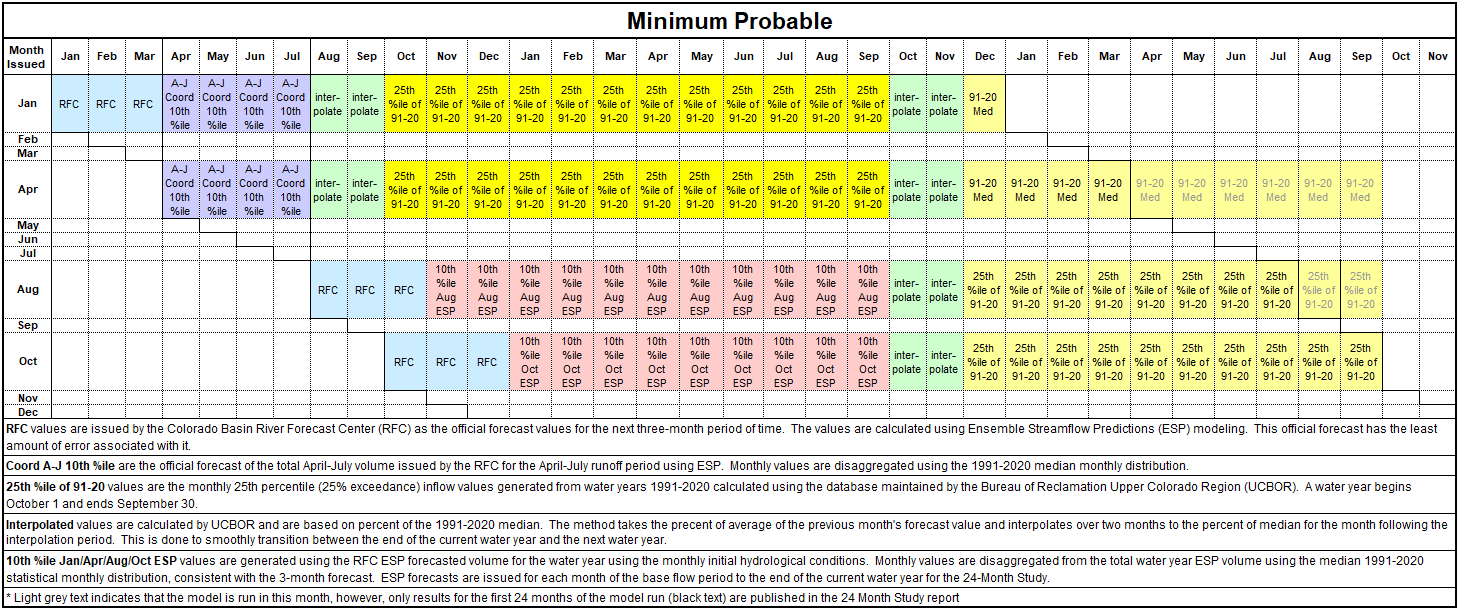
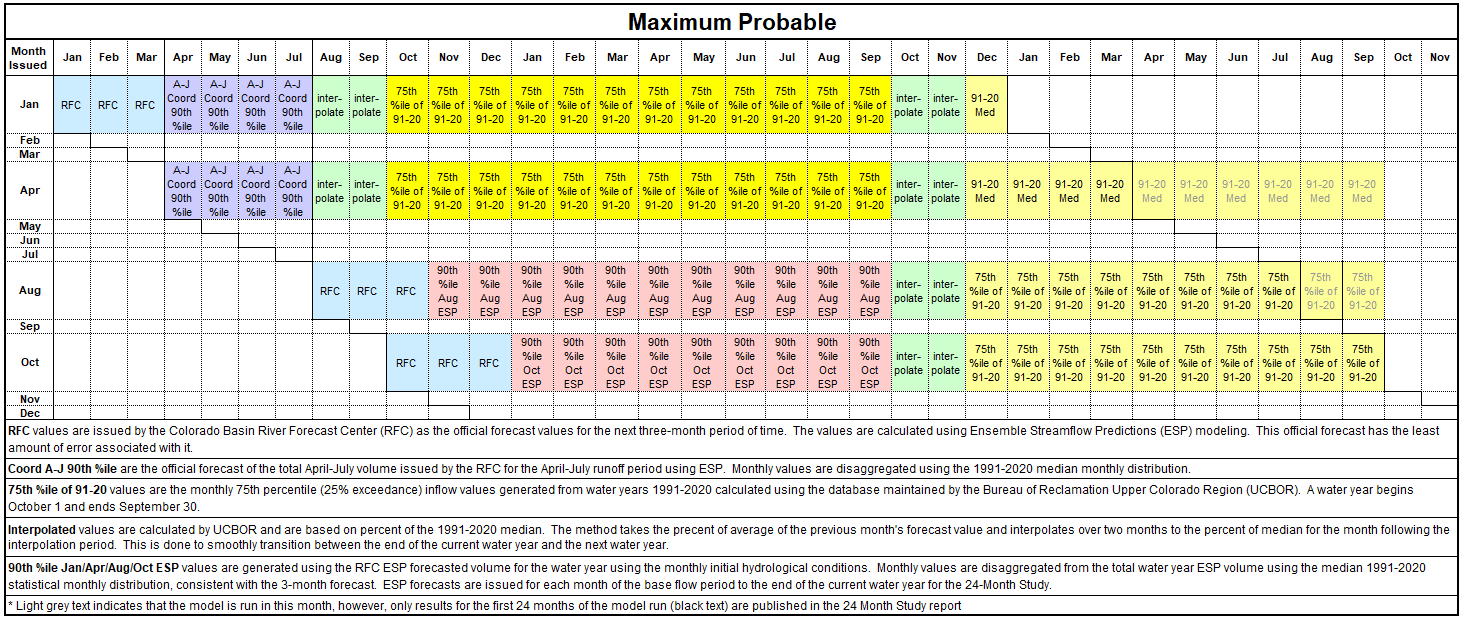
Intervening flows are input to the seven forecast locations in the Lower Basin, though one Upper Basin reach, from Glen Canyon Dam to Lees Ferry gage, is included in this set of flows. The seven forecast points use historical intervening flows from the previous 5-year period, which is rolled forward every March once the previous year’s intervening flows are finalized. For the reach from Glen Canyon Dam to Hoover Dam, the Minimum, Maximum, and Most Probable traces use different statistics of the 5-year intervening flow record. For the Most Probable 24-Month Study, the average intervening flows for the 5-year are used for the full 24-month period. The Probable Minimum and Maximum 24-Month Studies use a combination of different percentiles, similar to the Upper Basin traces. For the Probable Minimum (Maximum) trace, the 10th (90th) percentile is used followed by the 25th (75th) percentile in the following water year, and then the average, all from the 5-year period. The combination of these intervening flow percentiles matches the combination of percentiles used in the Minimum and Maximum Probable matrices shown above. For the reaches below Hoover Dam, the average of the 5-year period is used for the Most, Minimum, and Maximum traces.
Water Demands
Water use and demands are handled differently between the Upper Basin, Lower Basin, and Mexico. Unregulated streamflow forecasts are used in the Upper Basin, which means water use is embedded in the flow with the exception of three diversions that are modeled explicitly in the 24-Month Study (Gunnison Tunnel, San Juan Chama exports, and Navajo Indian Irrigation Project diversions). For the Lower Basin, water use is modeled explicitly and is based on approved schedules provided by Lower Basin water users for the first year of the model run. In the out-years, the model assumes schedules based on a Normal or ICS Surplus condition, which are then revised based on projected basin-wide conditions for out-years in the model run. Similar to the Lower Basin, Mexico’s water use in the first year is modeled based on approved water use schedules. In the out-years, the model initially assumes that Mexico will take its 1.5 million acre-feet Treaty allotment under Normal or ICS Surplus Conditions. This assumption is then refined based on projected basin-wide water supply conditions.
CRMMS Ensemble Mode
The 2-Year and 5-Year Probabilistic Projections of future Colorado River system conditions are created using the Colorado River Mid-term Modeling System (CRMMS) in Ensemble Mode. The projections provide information about risk and uncertainty for a one- to five-year planning horizon. The 2-Year Probabilistic Projections are updated monthly, while the 5-Year Probabilistic Projections are typically updated every January, April, and August. CRMMS Ensemble Mode uses an ensemble of monthly unregulated streamflow forecasts developed by the National Weather Service Colorado Basin River Forecasting Center (CBRFC) using the Ensemble Streamflow Prediction (ESP) method. Results from CRMMS run with ESP are referred to as CRMMS-ESP.
Model and Policy
CRMMS is implemented in RiverWareTM, a software developed and maintained by the Center for Advanced Decision Support for Water and Environmental Systems (CADSWES) at the University of Colorado Boulder. The model simulates monthly operations at twelve reservoirs (nine in the Upper Basin and three in the Lower Basin). Operations for these reservoirs are represented with logic included in the models, which are consistent with the various operating policies and rules that define Colorado River Basin operations. More information can be found in the Policy tab.
Hydrology
CRMMS has twelve hydrologic inflow points in the Upper Basin, and seven in the Lower Basin. The Upper Basin forecast locations are unregulated inflows, which are gaged flows adjusted for the effects of upstream reservoirs but not depletions, with the exception of the Gunnison Tunnel, Azotea Tunnel, and Navajo Indian Irrigation Project diversions. A description of unregulated flows and the historical unregulated Lake Powell inflow record are found in the Hydrology. The Lower Basin flows are intervening flows, which are the amount of flow entering the system between an upstream and downstream point.
CRMMS uses unregulated Upper Basin streamflow forecasts provided by the CBRFC. The CBRFC generates these forecasts using a technique known as Ensemble Streamflow Prediction (ESP). This technique generates multiple time series, i.e. traces, of forecasted streamflow. Forecasts are created using the Sacramento Soil Moisture Accounting hydrologic model, which is initialized with current basin conditions for soil moisture and snowpack and forced with a set of historical time series of precipitation and temperature that matches the model calibration period (currently 1991 through 2020). This process results in a 30-member ensemble for monthly streamflow forecasts with temperature and precipitation that match the 1991-2020 climatological period. A depiction of this process is shown below. More information about the CBRFC ESP process can be found on their website.
Intervening flows are used for the seven forecast locations in the Lower Basin, though one reach, from Glen Canyon Dam to the Lees Ferry gage, is included in this set of flows. These seven forecast points use historical intervening flows that match the climatological period used in the Upper Basin ESP forecasts (1991-2020). The intervening flow trace is set up to match the same historical year that is used in the creation of ESP. For example, the Upper Basin inflow forecast corresponding to the 1991 trace is generated from the temperature and precipitation from 1991 through 1992. In this 1991 trace, the intervening inflows for all seven reaches below Glen Canyon Dam would be the historical calculated intervening inflows from 1991 through 1992.
Water Demands
Water use and demands are handled differently between the Upper Basin, Lower Basin, and Mexico. Unregulated streamflow forecasts are used in the Upper Basin, which means water use is embedded in the flow with the exception of three diversions that are modeled explicitly in the 24-Month Study (Gunnison Tunnel, San Juan Chama exports, and Navajo Indian Irrigation Project diversions). For the Lower Basin, water use is modeled explicitly and is based on approved schedules provided by Lower Basin water users for the first year of the model run. In the out-years, the model assumes schedules based on a Normal or ICS Surplus condition, which are then revised based on projected basin-wide conditions for out-years in the model run. Similar to the Lower Basin, Mexico’s water use in the first year is modeled based on approved water use schedules. In the out-years, the model initially assumes that Mexico will take its 1.5 million acre-feet Treaty allotment under Normal or ICS Surplus Conditions. This assumption is then refined based on projected basin-wide water supply conditions.
CRSS
The Colorado River Simulation System (CRSS) is used for long-term studies, policy exploration, scenario comparisons, and supplementary resource analyses. CRSS was also used to generate the 5-Year Probabilistic Projections until February 2022. Beginning in February 2022, the 5-Year Probabilistic Projections are produced using Colorado River Mid-term Modeling System (CRMMS). CRSS is initialized in January using either observed reservoir conditions from December of the previous year or CRMMS projections of the end of the current year conditions. CRSS relies on natural flow for its future hydrology. This can be a subset of the historical natural flow record or a scenario constructed using various other methods.
Model and Policy
CRSS is implemented in RiverWareTM, a software developed and maintained by the Center for Advanced Decision Support for Water and Environmental Systems (CADSWES) at the University of Colorado Boulder. The model simulates monthly operations at twelve reservoirs (nine in the Upper Basin and three in the Lower Basin). Operations for these reservoirs are represented with logic included in the models, which are consistent with the various operating policies and rules that define Colorado River Basin operations. More information can be found in the Policy tab.
Hydrology
There are several methods for projecting possible future natural flow sequences or hydrology scenarios for the 29 natural flow points in CRSS. Because CRSS is a long-term model capable of projecting decades into the future, hydrologic inputs are derived from methods designed to represent future uncertainty in hydrologic variability and long-term change. These methods include resampling the historical record (either from the measured record or a derived record using a “proxy” such as tree-ring data), deriving future inflow data by preserving key statistics from the historical record while adding a random component, and using physically based hydrology models to simulate runoff based on general circulation model projections of temperature and precipitation.
The Colorado River Basin Water Supply and Demand Study assessed future streamflow projections derived from each of these methods and compared projections of the Colorado River system under each projection. Comparing projections of the Colorado River system using different future hydrology scenarios, while keeping other modeling assumptions the same, illustrates how sensitive the system is to the assumed future hydrology and highlights how risk may change with different future hydrology assumptions.
One common method used to generate future includes resampling a subset of the historical natural flow record using the Index Sequential Method (ISM). The full historical record of natural flows spans 1906 to 2019 (known as the “Full” hydrology), while resampling 1988 to 2019 is referred to here as “Stress Test” hydrology. The Stress Tests hydrology scenario removes the earlier portion of the natural flow record and focuses on the recent (approximately 30 years) hydrology. This period has a 10% drier average flow than the Full hydrology. Use of the Stress Test scenario is supported by multiple research studies that identified a shifting temperature trend in the Colorado River Basin in the late 1980s that affected runoff efficiency and resulted in lower average flows for the same amount of precipitation (McCabe et al. 2017, Udall and Overpeck 2017, Woodhouse et al. 2016).
Water Demands
In CRSS, future water demands for the Upper Division States are based on the 2016 Upper Colorado River Commission (UCRC) depletion and demand schedule. Reclamation used the 2016 UCRC depletion demand schedule in CRSS for the first time in the January 2021 CRSS official run. The Upper Division States and UCRC assisted with the representation of this new schedule in CRSS. During this process, the need for additional refinements to the representation of Upper Colorado River Basin water use in CRSS was identified. Reclamation is currently working with the Upper Division States and UCRC on these refinements.
Future water demands for the Lower Division States and Mexico for the first year of simulation reflect water use as modeled by the 24-Month Study. Beyond the first year during Normal Conditions, water demands are set to the schedules provided during modeling for the 2007 Final Environmental Impact Statement for the Colorado River Interim Guidelines with updates to Nevada’s demands in May 2019. Assumptions reflecting possible Intentionally Created Surplus creation or delivery are updated regularly in coordination with Lower Basin water users.
Approach
There has always been significant uncertainty associated with projecting future hydrology in the Colorado River Basin, as clearly illustrated by the high variability of inflow across the more than 100 years of the historical observed record (1906 through present). Decades of Colorado River Basin research along with recent hydrologic conditions suggest that this uncertainty is likely increasing.
CRSS simulations always start in January and therefore may be initialized using different sources of initial conditions depending on the timing of the run or the purpose of the study. CRSS can be initialized using observed end-of-year reservoir conditions or it can be initialized using CRMMS-projected end-of-year reservoir projections. CRSS then simulates at a monthly timestep through the end of the simulation period, which could extend through 2060.
Hydrology
The future hydrology inputs used in Colorado River Basin models are developed using different methodologies. CRMMS uses unregulated inflows for forecast points in the Upper Basin, while CRSS uses natural flows. The distinction between gaged flow, unregulated flow, and natural flow can be seen in the figure below.
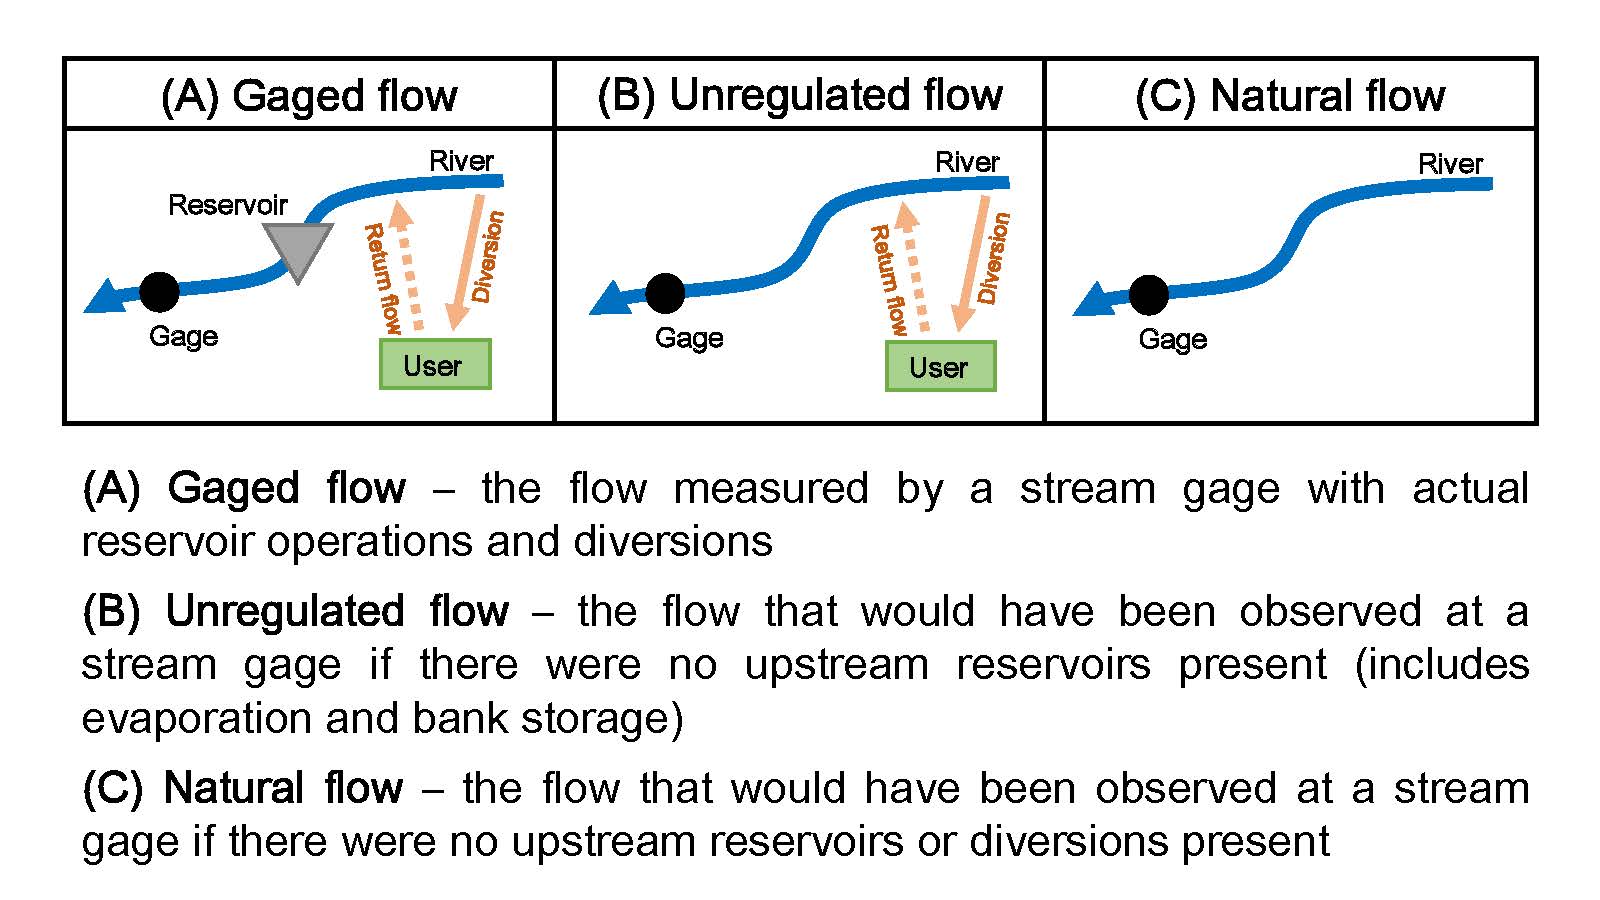
Unregulated Inflows
The Colorado River unregulated inflow is the gaged flow adjusted to remove the effects of upstream reservoirs, but not depletions, with the exception of the Gunnison Tunnel diversion, San Juan Chama exports, and Navajo Indian Irrigation Project diversion, which are all modeled explicitly in CRMMS. Unregulated inflow represents the flow that would have occurred at a location if reservoir regulation had not been present upstream of that location. For more information about how unregulated flows are used in CRMMS, see the CRMMS 24-Month Study Mode and CRMMS Ensemble Mode tabs. The historical Colorado River unregulated inflow into Lake Powell is shown in the figure below.
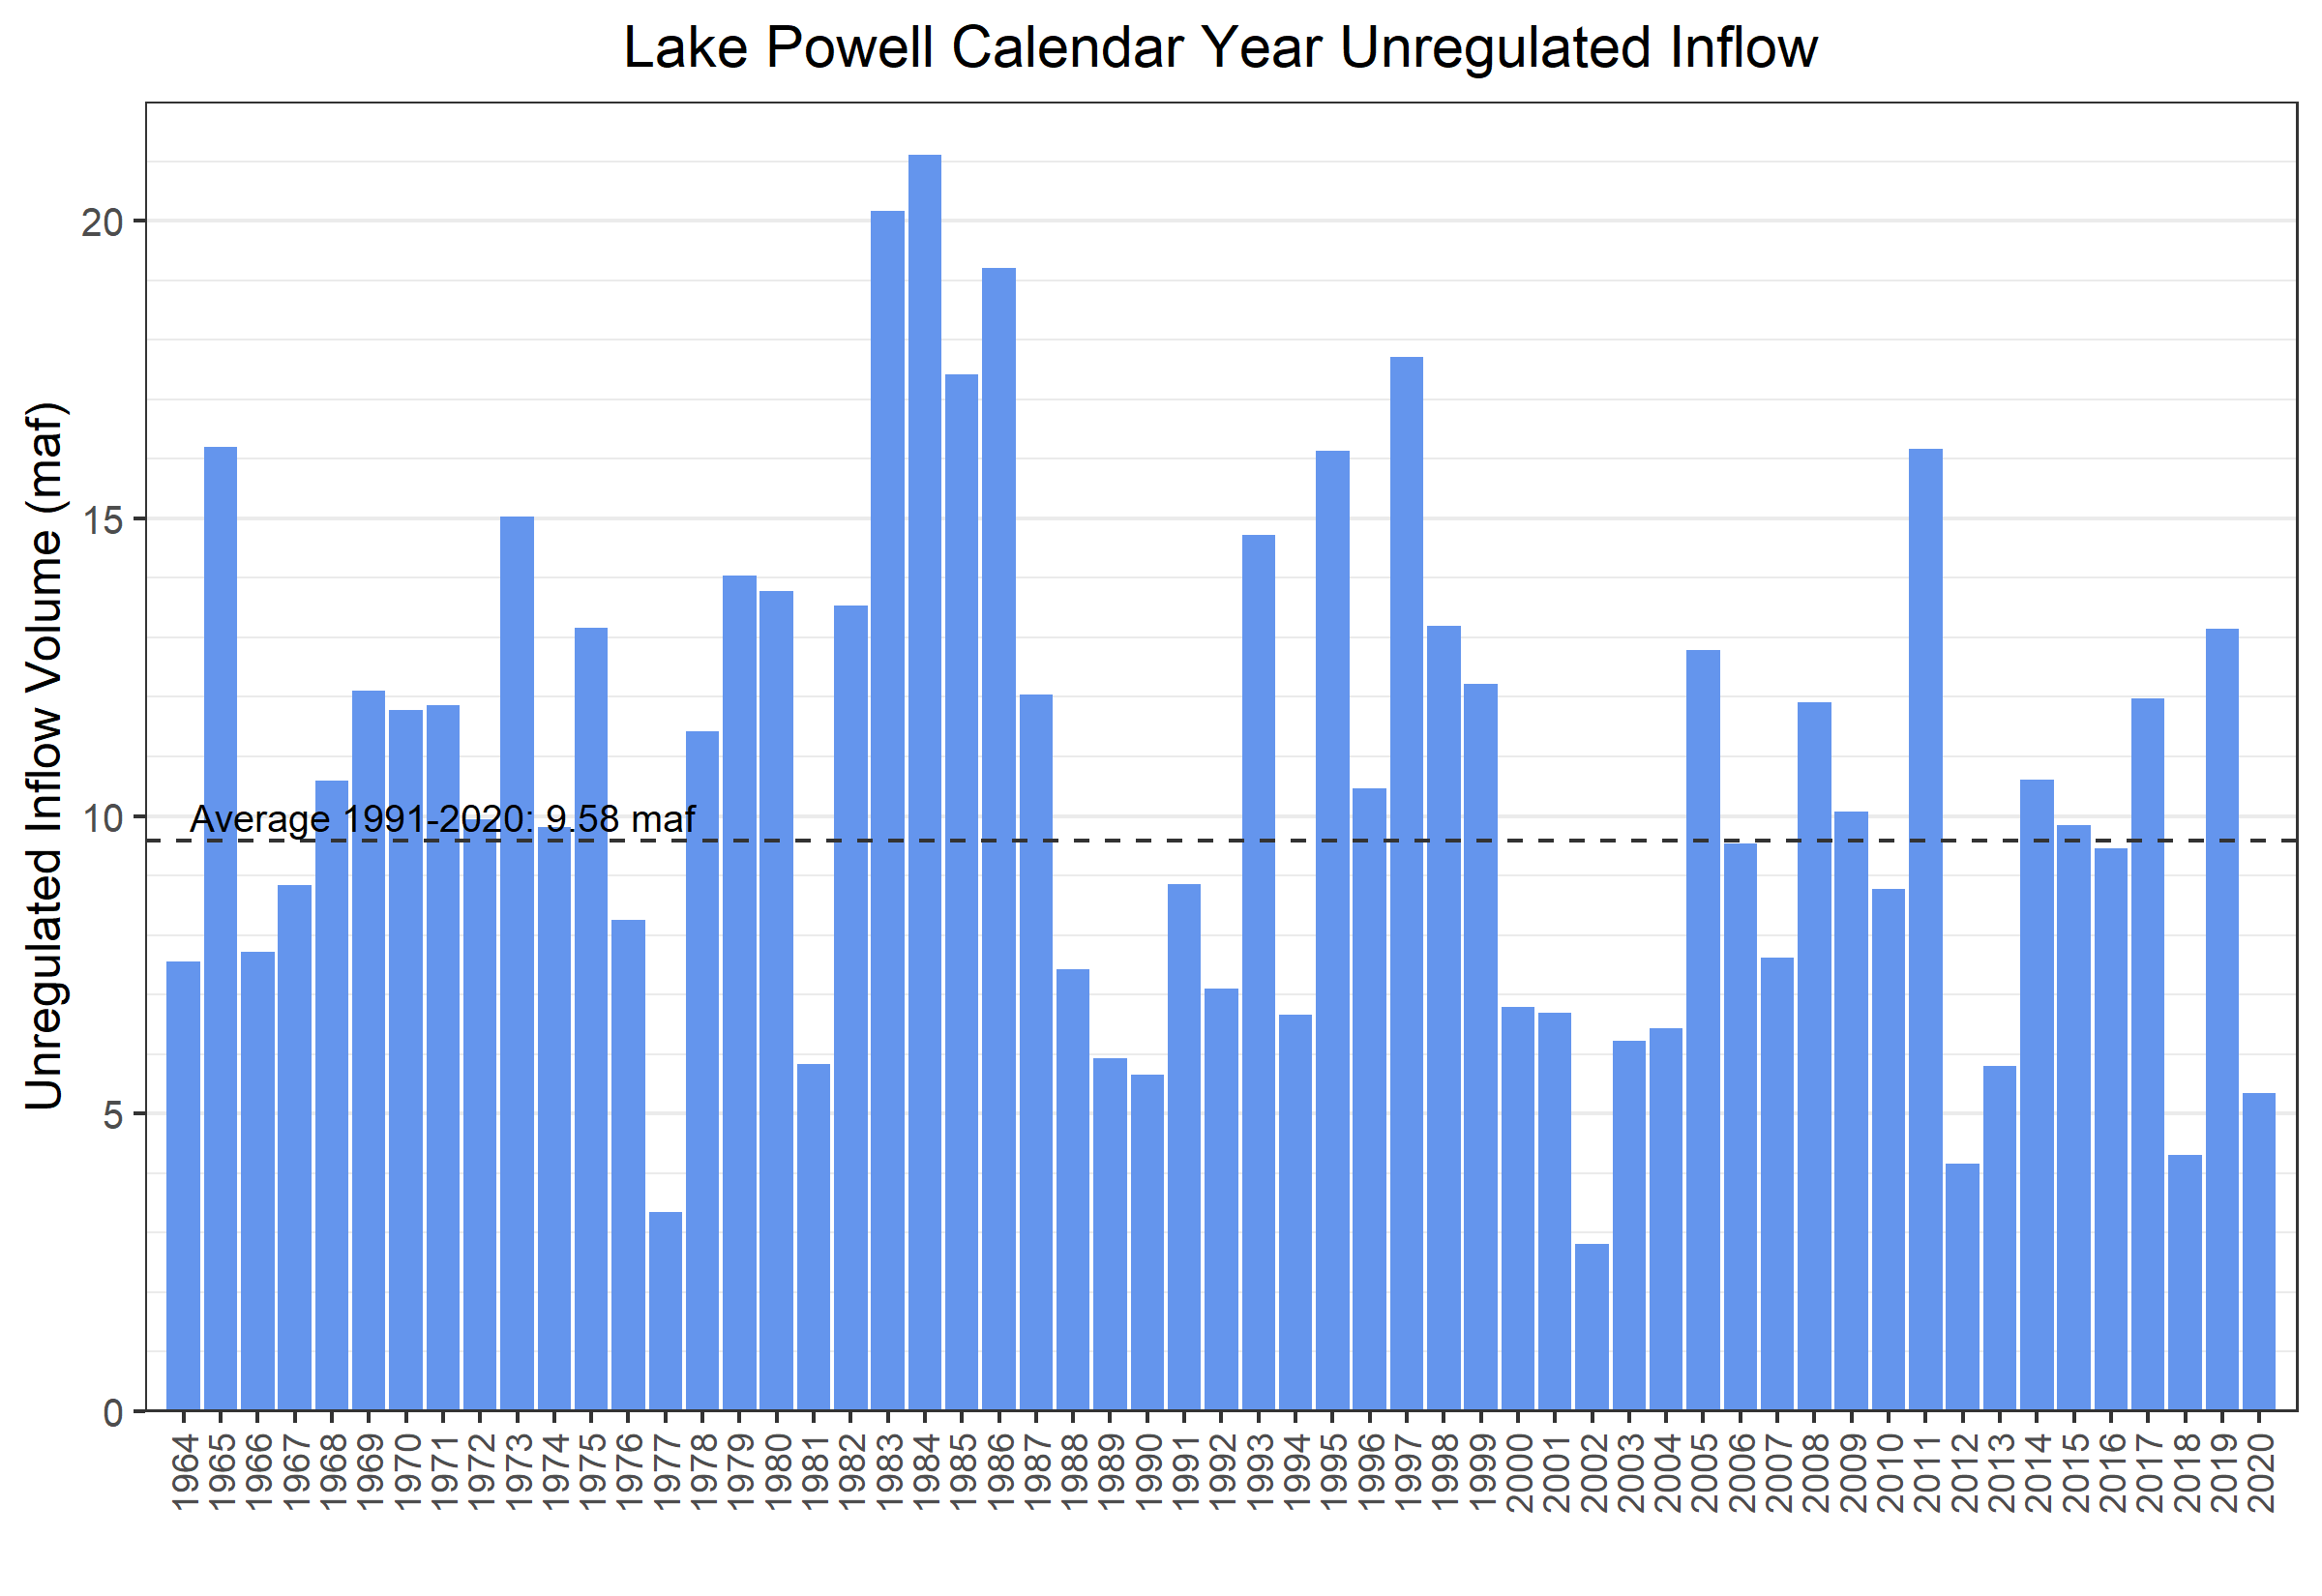 Historical annual unregulated inflow from 1964-2020.
Natural Flows
The Colorado River natural flow is the observed flow adjust to remove the effects of upstream reservoirs and depletions. It represents the flow that would have occurred at a location had depletions and reservoir regulation not been present upstream of that location. The historical Colorado River natural flow at the Lees Ferry gaging station in Arizona is shown in the figure below.
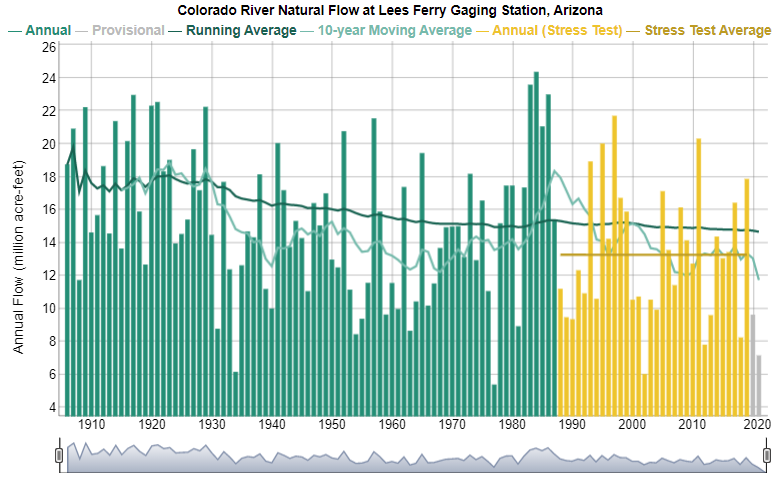 Historical annual natural flow from 1906-2019.
Colorado River System Operating Policies
The modeled operations for CRMMS and CRSS are consistent with the 2007 Interim Guidelines, the 2024 Supplement to the 2007 Interim Guidelines, the Drought Response Operations Agreement, the 2019 Drought Contingency Plans, and the International Boundary Water Commission (IBWC) Minute 323 to the 1944 Treaty with Mexico including the Binational Water Scarcity Contingency Plan. Neither Drought Response Operations nor demand management per the Upper Basin Drought Contingency Plan are currently modeled. Modeled operations for Upper Basin reservoirs above Lake Powell are consistent with the appropriate Record of Decision.
CRMMS contains assumptions for approved actions for the 2022 Drought Response Operations Plan and Glen Canyon Dam operational adjustment. The 2022 Drought Response Operations Plan includes an additional release of 500 kaf from Flaming Gorge from May 2022 through April 2023. The Glen Canyon Dam operational adjustment reduces the Glen Canyon Dam annual release to 7.00 maf in water year 2022. The Glen Canyon Dam operational adjustment reduces the releases from Lake Powell from 7.48 maf to 7.00 maf in water year 2022 will result in a reduced release volume of 0.48 maf that normally would have been released from Glen Canyon Dam to Lake Mead as part of the 7.48 maf annual release volume, consistent with routine operations under the 2007 Interim Guidelines. The reduction of releases from Glen Canyon Dam in water year 2022 (resulting in increased storage in Lake Powell) will not affect future operating determinations and will be accounted for “as if” this volume of water had been delivered to Lake Mead. Recognizing that operational decisions for 2023 and beyond have not been made, for all hydrologic scenarios that project Glen Canyon Dam to operate in a balancing condition in a future water year, releases will be simulated in a manner that preserves the benefits to Glen Canyon Dam facilities and operations.
The diagram below depicts the coordinated operations for Lakes Powell and Mead per the 2007 Interim Guidelines.
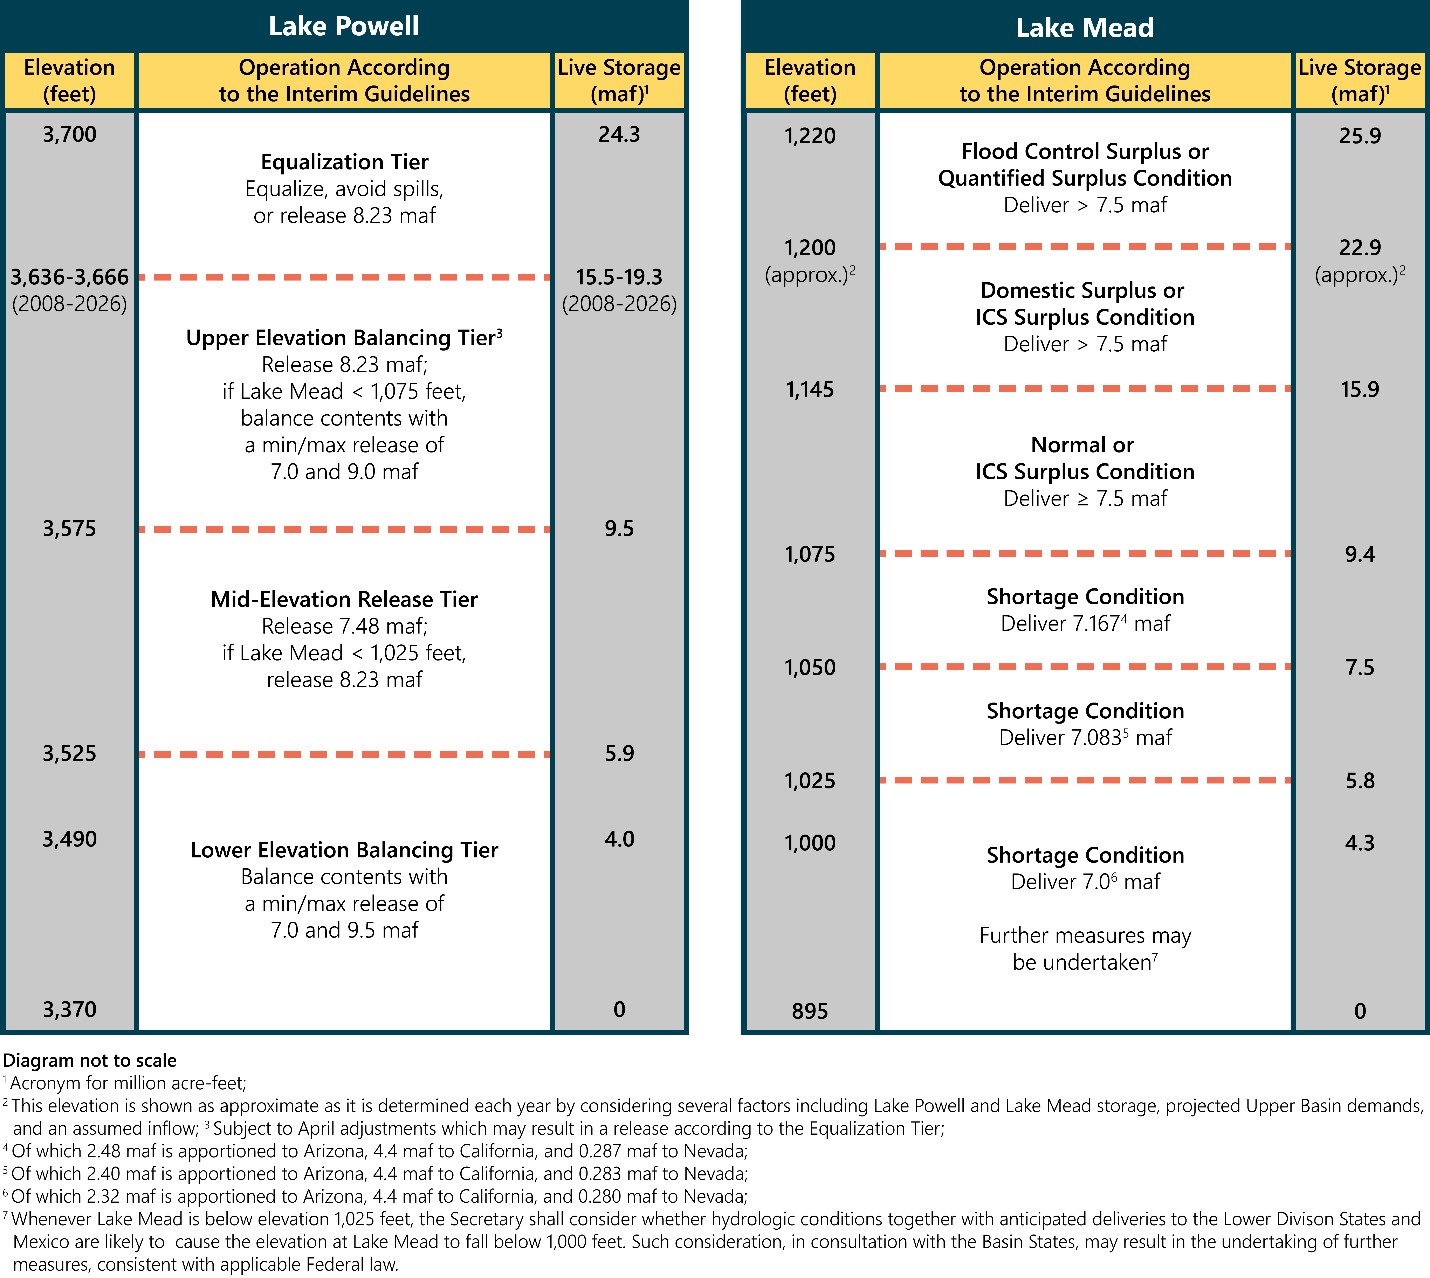 Lake Powell and Lake Mead coordinated operational diagram.
The diagram below shows the required Lower Basin volumes under the 2007 Interim Guidelines, IBWC Minute 323, Lower Basin Drought Contingency Plan, and Binational Water Scarcity Contingency Plan at different Lake Mead end-of-calendar-year elevation thresholds.
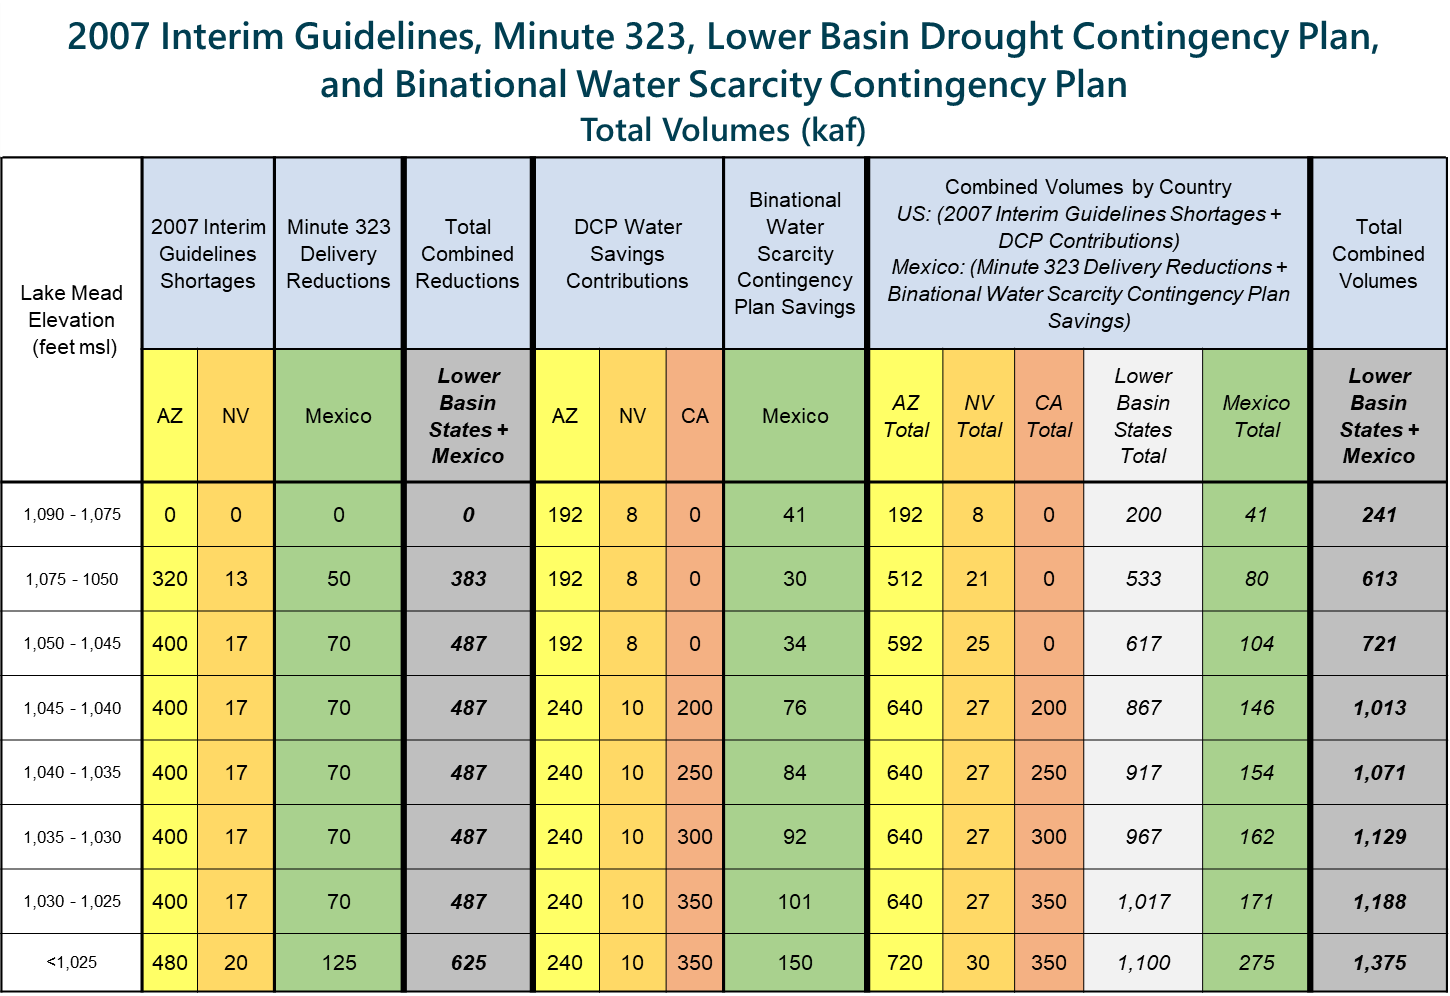 Water savings contributions under the 2007 Interim Guidelines, IBWC Minute 323, Lower Basin Drought Contingency Plan, and Binational Water Scarcity Contingency Plan.
Sources of Uncertainty
All system projections are subject to multiple sources of uncertainty. One source is the model, which is a simplified representation of a complex system. Another component of uncertainty is the need to estimate physical processes such as reservoir evaporation and transpiration from plants. The most impactful source of uncertainty is the future itself- models rely on assumptions about how hydrology, water demand, and policy/operations will unfold. Reclamation works with stakeholders and scientists to develop the best modeling practices and most appropriate assumptions in light of the purpose of each model. It is important to understand the purpose, approach, and assumptions associated with each set of projections and their inherent uncertainty to properly interpret the information they provide.
Projections are most sensitive to assumptions about future hydrology, and future flows are highly uncertain. Assumptions about future hydrology based on different datasets can produce very different pictures of risk. For example, risks of reaching low reservoir elevations calculated when assuming the possibility of experiencing flows from the full observed natural flow record spanning 1906 to 2019 are much lower than if we consider only sequences from the observed natural flow record spanning 1988 to 2019 because this portion of the record is significantly drier. There are many other sources of hydrologic data, e.g., paleo records and climate projections, that provide yet different views of risk.
The further out projections look, the more uncertainty exists. This is apparent when comparing the different ranges of possible conditions in 2-Year and 5-Year Probabilistic projections. As time horizons extend and uncertainty increases, projections of statistics-based measures such as risks of certain system conditions become less reliable as representations of the true probabilities that specific events may occur. When it is impossible to confidently state probabilities or identify the best hydrology, demand, and policy assumptions, this context is called “deep uncertainty,” and it requires special planning techniques. Reclamation has previously used, and is continuing to research, Decision Making under Deep Uncertainty (DMDU) methods. Refer to the Colorado River Basin Water Supply and Demand Study - Technical Report G and Colorado River Basin Research-to-Operations Program for more information.
Modeling Assumptions
Key model assumptions and differences between the basin-wide models used by Reclamation to project future Colorado River system conditions are summarized in the table below.
| Colorado River Mid-term Modeling System (CRMMS) | Colorado River Simulation System (CRSS) | ||
|---|---|---|---|
| 24-Month Study Mode | Ensemble Mode | ||
| Primary Use | AOP tier determinations and projections of current conditions | Risk-based operational planning and analysis during mid-term time period | Long-term planning studies, operational criteria development, and risk analysis |
| Probablistic or Deterministic | Deterministic | Probablisitc | |
| Simulated Reservoir Operations | Manually input operations | Rule-driven operations | |
| Simulation Start Date | Current month of current calendar year | January of next calendar year | |
| Reservoir Initial Conditions | Based on observed reservoir elevations from the last day of the previous month | Actual or projected December 31 conditions of the previous or current year. Projected conditions are based on either CRMMS-ESP or the 24-Month Study. | |
| Upper Basin Reservoirs above Lake Powell Operations | Operations are consistent with the appropriate Record of Decision (Flaming Gorge, Navajo and the Aspinall Unit). | ||
| Lake Powell and Lake Mead Operations | Operations are consistent with the 2007 Colorado River Interim Guidelines, Lower Basin Drought Contingency Plan, and Minute 323 to the 1944 Treaty with Mexico including the Binational Water Scarcity Contingency Plan. | ||
| Upper Basin Inflows | Single "Most Probable" trace that combines Colorado Basin River Forecast Center. (CBRFC) for the first year, and 30-year historical median for the out-years. Minimum and Maximum Probable traces represent dry and wet hydrologic scenarios, respectively. | Ensemble Streamflow Prediction (ESP) unregulated inflow forecasts with 30 potential inflow traces based on historical temperature and precipitation from 1991-2020, provided by the Colorado Basin River Forecast Center. | Several methods available to generate future natural flows. These include resampling the historical natural flow record (1906-present) or tree-ring record, or deriving streamflow from general circulation model simulations. |
| Lower Basin Inflows | Intervening flows are based on a 5-year moving average of the historical record. | Intervening flows are assigned using historical flows from 1991-2020, using an index-sequential method. Each historical inflow trace corresponds to the same time period as the temperature and precipitation used in the the development of the Upper Basin inflow forecast trace. | Several method available to generate future natural flows. These include resampling the historical natural flow record (1906-present) or tree-ring record, or deriving streamflow from general circulation model simulations. |
| Upper Basin Water Demands | Estimated and incorporated in the unregulated inflow forecasts provided by the CBRFC, except for three tunnel diversions. | Developed in coordination with the Upper Colorado River Commission | |
| Lower Basin Water Demands | Developed in coordination with the Lower Basin States and Mexico | ||
For additional information or questions, please contact us via email at: ColoradoRiverModeling@usbr.gov.
To be notified when updated projections are available, please email ColoradoRiverModeling@usbr.gov with “Add Me” as the subject.
