5-Year Probabilistic Projections
- 24-Month Study Projections
- 2-Year Probabilistic Projections
- 5-Year Probabilistic Projections
Overview
Five-Year Probabilistic Projections of future conditions in the Colorado River system currently extend through 2027. They are typically updated every January, April, and August, while probabilistic results for the 2-year period are updated every month. The 5-Year Probabilistic Projections are generated using the Colorado River Mid-term Modeling System (CRMMS) in Ensemble Mode. CRMMS Ensemble Mode is driven by an ensemble of monthly unregulated streamflow forecasts developed by the National Weather Service Colorado Basin River Forecasting Center (CBRFC) using the Ensemble Streamflow Prediction (ESP) method. Results from CRMMS run with ESP are referred to as CRMMS-ESP.
The most recent 5-year projections of future Colorado River system conditions were produced using the following assumptions:
- Initial Conditions: CRMMS is initialized with previous end-of-month reservoir elevations.
- Hydrology: Upper Basin inflows are 30 unregulated inflow forecasts traces produced by the CBRFC using the ESP method, which relies on observed temperature and precipitation from 1991-2020. Lower Basin inflows are the historical intervening flows from 1991-2020 that align with the ESP traces.
- Water Demand: Upper Basin demands are estimated and incorporated in the unregulated inflow forecasts provided by the CBRFC; Lower Basin demands are developed in coordination with the Lower Basin States and Mexico.
- Policy: 2007 Interim Guidelines, 2024 Supplement to the 2007 Interim Guidelines, Lower Basin Drought Contingency Plan, and Minute 323 and 330 to the 1944 U.S-Mexico Water Treaty are modeled reflecting Colorado River policies.
Additional details are available in CRMMS Ensemble Mode page. All modeling assumptions and projections are subject to varying degrees of uncertainty. Please refer to this discussion of uncertainty for more information.
Projections
5-Year Probabilistic Projections presented in the tables below are reported as the percentage of projected Lake Powell and Lake Mead operations that fall below critically low elevations or are within each operational tier in the next five years.
| Run | WY 2026 | WY 20272 | WY 20282 | WY 20292 | WY 20302 | |
|---|---|---|---|---|---|---|
|
Lake Powell less than 3,525 feet |
April 2025 | 10% | 13% | 13% | 17% | 10% |
| August 2025 | 77% | 50% | 30% | 27% | 20% | |
| Difference | 67% | 37% | 17% | 10% | 10% | |
|
Lake Powell less than 3,490 feet (minimum power pool) |
April 2025 | 0% | 0% | 3% | 0% | 0% |
| August 2025 | 0% | 10% | 10% | 3% | 7% | |
| Difference | 0% | 10% | 7% | 3% | 7% | |
|
Lake Powell less than 3,375 feet (dead pool = 3,370 feet) |
April 2025 | 0% | 0% | 0% | 0% | 0% |
| August 2025 | 0% | 0% | 0% | 0% | 0% | |
| Difference | 0% | 0% | 0% | 0% | 0% | |
| Run | WY 2026 | WY 20272 | WY 20282 | WY 20292 | WY 20302 | |
|---|---|---|---|---|---|---|
|
Lake Mead less than 1,035 feet |
April 2025 | 0% | 20% | 30% | 27% | 23% |
| August 2025 | 3% | 53% | 50% | 53% | 40% | |
| Difference | 3% | 33% | 20% | 26% | 17% | |
|
Lake Mead less than 1,020 feet |
April 2025 | 0% | 3% | 10% | 23% | 17% |
| August 2025 | 0% | 10% | 23% | 27% | 23% | |
| Difference | 0% | 7% | 13% | 4% | 6% | |
|
Lake Mead less than 950 feet (minimum power pool) |
April 2025 | 0% | 0% | 0% | 0% | 0% |
| August 2025 | 0% | 0% | 0% | 7% | 3% | |
| Difference | 0% | 0% | 0% | 7% | 3% | |
|
Lake Mead less than 900 feet (dead pool = 895 feet) |
April 2025 | 0% | 0% | 0% | 0% | 0% |
| August 2025 | 0% | 0% | 0% | 0% | 0% | |
| Difference | 0% | 0% | 0% | 0% | 0% | |
|
Notes: 1 All results are computed as the chance of falling below physical elevations in any month in the calendar (water) year for Lake Mead (Lake Powell). 2 For modeling purposes, simulated years beyond 2026 assume a continuation of the 2007 Interim Guidelines including the 2024 Supplement to the 2007 Interim Guidelines (no additional SEIS conservation is assumed to occur after 2026), the 2019 Colorado River Basin Drought Contingency Plans, and Minute 323 including the Binational Water Scarcity Contingency Plan. With the exception of certain provisions related to ICS recovery and Upper Basin demand management, operations under these agreements are in effect through 2026. Reclamation initiated the process to develop operations for post-2026 in June 2023, and the modeling assumptions described here are subject to change. |
| Upper Basin - Lake Powell - Operating Condition | 2026 | 20272 | 20282 | 20292 | 20302 |
|---|---|---|---|---|---|
| Equalization Tier (Powell >= Equalization [EQ] Elevation) | 0 | 0 | 3 | 13 | 13 |
| Equalization - annual release > 8.23 maf | 0 | 0 | 3 | 13 | 13 |
| Equalization - annual release = 8.23 maf | 0 | 0 | 0 | 0 | 0 |
| Upper Elevation Balancing Tier (Powell < EQ Elevation and >= 3,575 ft) | 0 | 23 | 40 | 37 | 40 |
| Upper Elevation Balancing - annual release > 8.23 maf | 0 | 23 | 37 | 37 | 37 |
| Upper Elevation Balancing - annual release = 8.23 maf | 0 | 0 | 0 | 0 | 3 |
| Upper Elevation Balancing - annual release < 8.23 maf | 0 | 0 | 3 | 0 | 0 |
| Mid-Elevation Release Tier (Powell < 3,575 and >= 3,525 ft) | 100 | 33 | 30 | 30 | 33 |
| Mid-Elevation Release - annual release = 8.23 maf | 0 | 0 | 0 | 3 | 3 |
| Mid-Elevation Release - annual release = 7.48 maf | 100 | 33 | 30 | 27 | 30 |
| Lower Elevation Balancing Tier (Powell < 3,525 ft) | 0 | 43 | 27 | 20 | 13 |
| Lower Elevation Balancing - annual release > 8.23 maf | 0 | 13 | 10 | 10 | 7 |
| Lower Elevation Balancing - annual release < 8.23 maf | 0 | 30 | 17 | 10 | 7 |
| Release Adjustment to Avoid Declining Below 3,500 ft3 | 13 | 37 | 20 | 23 | 13 |
| Release Adjustment - annual release < target water year release | 13 | 10 | 13 | 13 | 10 |
| Release Adjustment - annual release < 7.00 maf | 7 | 10 | 10 | 7 | 7 |
| Lower Basin - Lake Mead - Operating Condition | 2026 | 20272 | 20282 | 20292 | 20302 |
|---|---|---|---|---|---|
| Surplus Condition - any amount (Mead >= 1,145 ft) | 0 | 0 | 0 | 0 | 0 |
| Surplus - Flood Control | 0 | 0 | 0 | 0 | 0 |
| Normal Year or ICS Surplus Condition (Mead < 1,145 and > 1,075 ft) | 0 | 7 | 3 | 10 | 13 |
| Recovery of DCP ICS / Mexico’s Water Savings (Mead >/>= 1,110 ft) | 0 | 0 | 0 | 0 | 3 |
| DCP Contribution / Mexico’s Water Savings (Mead <= 1,090 and > 1,075 ft) | 0 | 7 | 3 | 7 | 0 |
| Shortage Condition - any amount (Mead <= 1,075 ft) | 100 | 93 | 97 | 90 | 87 |
| Shortage / Reduction - 1st Level (Mead <= 1,075 and >= 1,050 ft) | 100 | 50 | 30 | 20 | 27 |
| DCP Contribution / Mexico’s Water Savings (Mead <= 1,075 and >= 1,050 ft) | 100 | 50 | 30 | 20 | 27 |
| Shortage / Reduction - 2nd Level (Mead < 1,050 and >= 1,025 ft) | 0 | 40 | 53 | 43 | 40 |
| DCP Contribution / Mexico’s Water Savings (Mead < 1,050 and > 1,045 ft) | 0 | 33 | 0 | 10 | 3 |
| DCP Contribution / Mexico’s Water Savings (Mead <= 1,045 and > 1,040 ft) | 0 | 0 | 13 | 10 | 10 |
| DCP Contribution / Mexico’s Water Savings (Mead <= 1,040 and > 1,035 ft) | 0 | 7 | 17 | 10 | 13 |
| DCP Contribution / Mexico’s Water Savings (Mead <= 1,035 and > 1,030 ft) | 0 | 0 | 13 | 7 | 3 |
| DCP Contribution / Mexico’s Water Savings (Mead <= 1,030 and >=/> 1,025 ft) | 0 | 0 | 10 | 7 | 10 |
| Shortage / Reduction - 3rd Level (Mead < 1,025 ft) | 0 | 3 | 13 | 27 | 20 |
| DCP Contribution / Mexico’s Water Savings (Mead </<= 1,025 ft) | 0 | 3 | 13 | 27 | 20 |
|
Notes:
1 All results computed as the percent of traces with a system condition. Percentages shown in this table may not be representative of the full range of future possibilities that could occur with different modeling assumptions. 2 For modeling purposes, simulated years beyond 2026 assume a continuation of the 2007 Interim Guidelines including the 2024 Supplement to the 2007 Interim Guidelines (no additional SEIS conservation is assumed to occur after 2026), the 2019 Colorado River Basin Drought Contingency Plans, and Minute 323 including the Binational Water Scarcity Contingency Plan. With the exception of certain provisions related to ICS recovery and Upper Basin demand management, operations under these agreements are in effect through 2026. Reclamation initiated the process to develop operations for post-2026 in June 2023, and the modeling assumptions described here are subject to change. 3 The 2024 Supplement to the 2007 Interim Guidelines may result in release adjustments in the Mid-Elevation Release and Lower Elevation Balancing Tiers if Lake Powell is projected to drop below 3,500 ft. Releases may be reduced, as needed, to not less than 6.0 maf from Lake Powell in the Water Year to maintain an elevation of 3,500 feet. |
Archived Tables
Previous tables (starting in January 2012) are also available. Select the date (a new window will open):
The following two figures show a combination of historical and projected reservoir elevations for Lake Powell and Lake Mead.
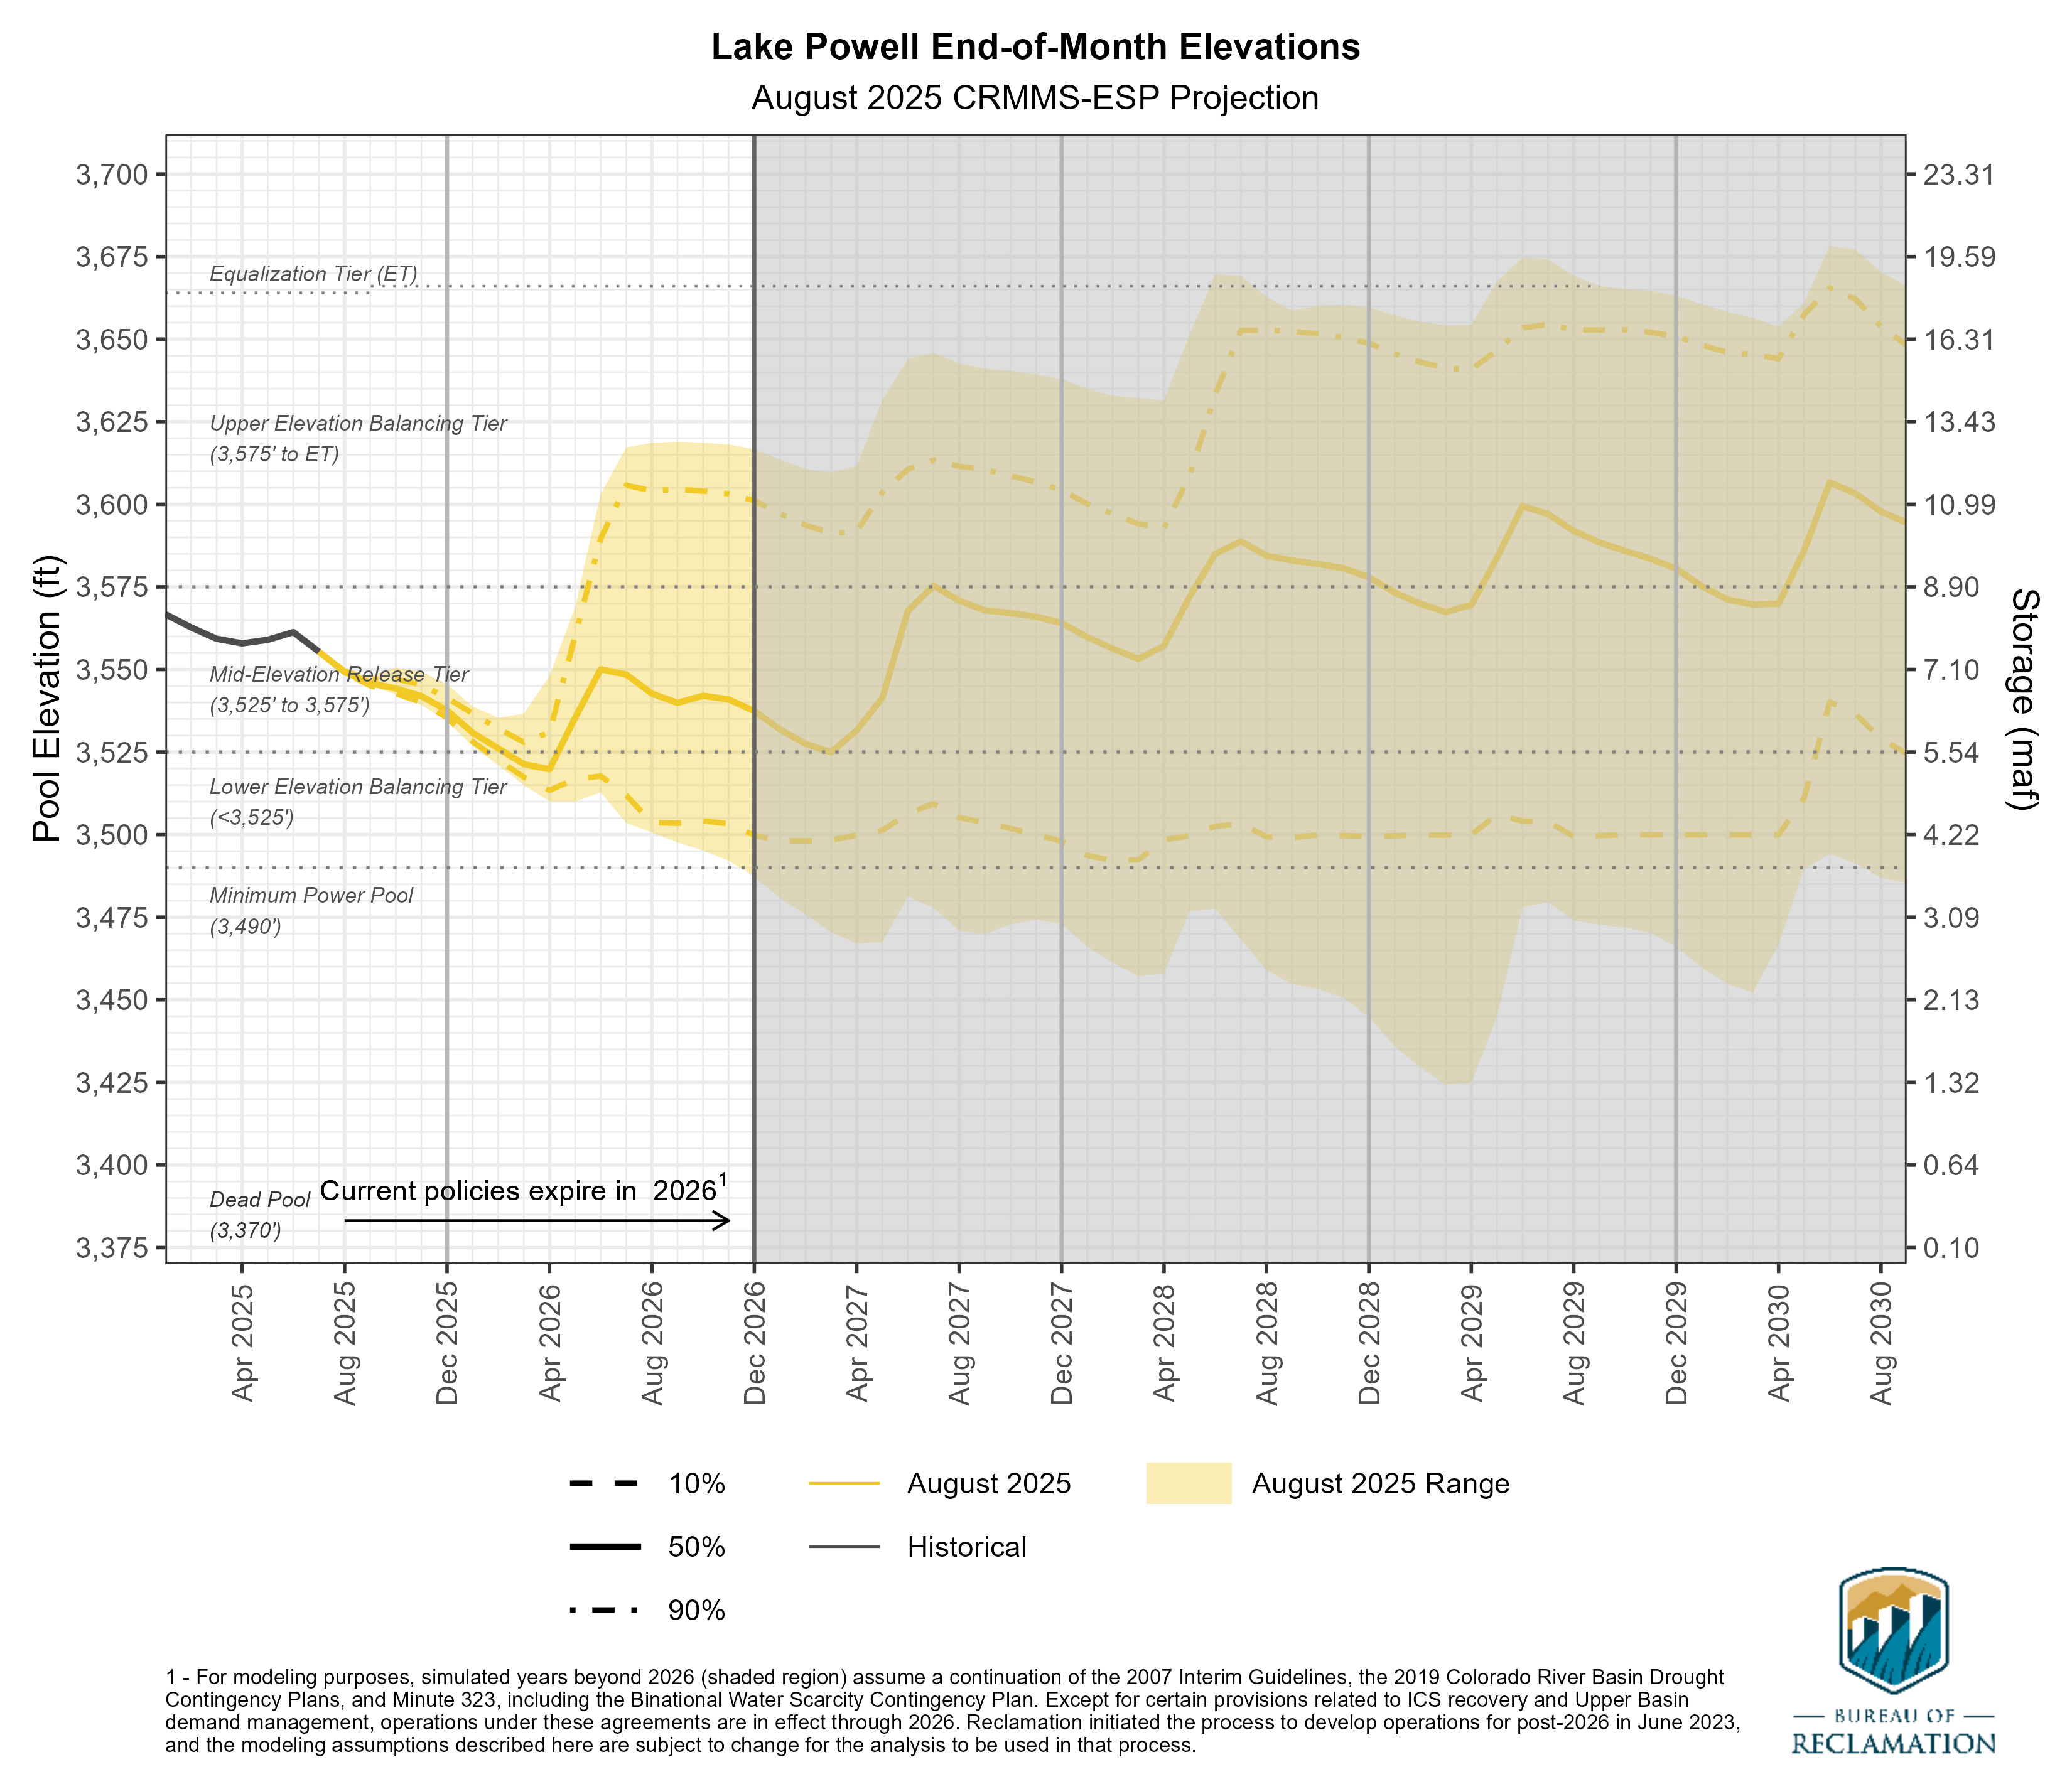
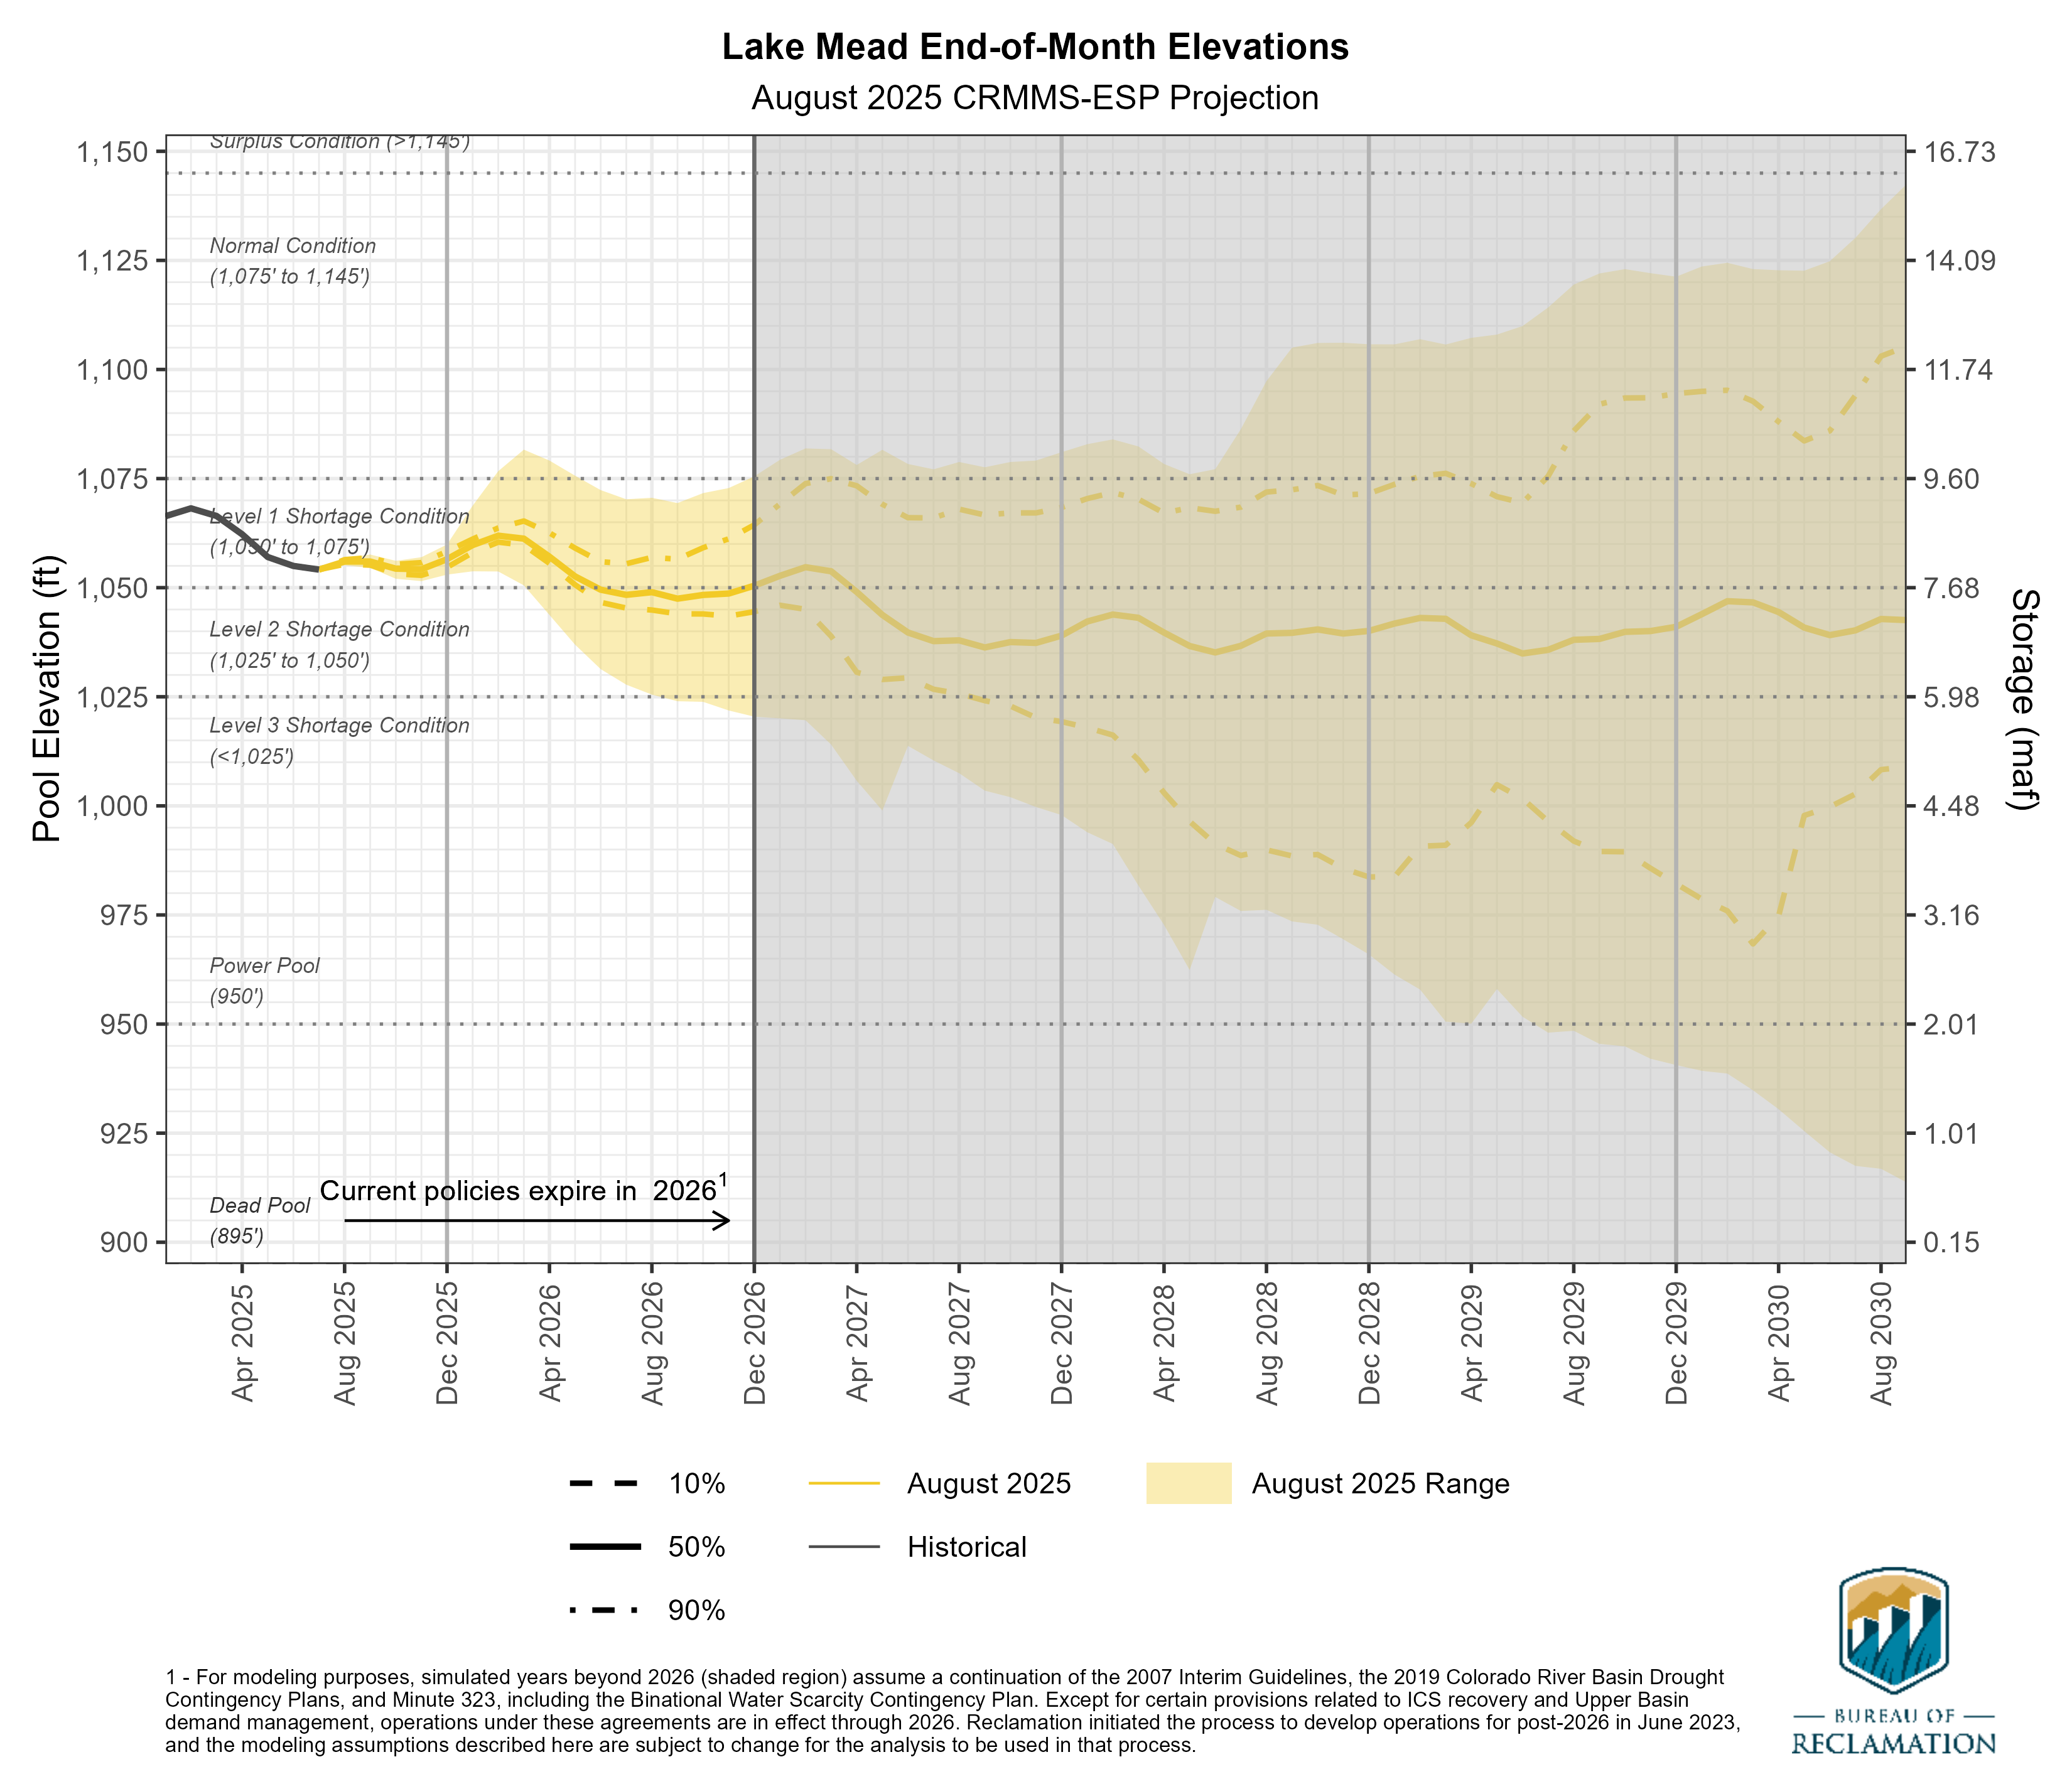
Projections of Lake Powell (top) and Lake Mead (bottom) end-of-month physical reservoir elevations. The colored region, or cloud, for the scenario represents the minimum and maximum of the projected reservoir elevations. Solid lines represent historical elevations (black), and median projected elevations for the scenario (yellow). Dashed and dot dashed lines represent the 10th and 90th percentiles, respectively. Horizontal gray lines represent important elevations for operations. These projections rely on future hydrology from the CBRFC’s ESP method and may not be representative of the full range of future possibilities that could occur; other hydrology methods may result in a wider range of future hydrology and elevations.
For additional information or questions, please contact us via email at: ColoradoRiverModeling@usbr.gov.
To be notified when updated projections are available, please email ColoradoRiverModeling@usbr.gov with “Add Me” as the subject.
Last updated: 2025-08-29
