- Reclamation
- Missouri Basin and Arkansas-Rio Grande-Texas Gulf
- AgriMet
- Irrigation Guide

AgriMet: Irrigation Guide
The main purpose for irrigating is to supply needed water for crops. While plants exchange gases with the air for photosynthesis, some water evaporates. Water is taken up from the soil by plant roots to replace this water. The water leaving the plant is called transpiration. The combination of transpiration from the plant and evaporation from the soil is called evapotranspiration, or "ET", and is considered to be the "crop water use".
The process of water being used by the plant and replaced by irrigation is sometimes compared to a checkbook because of the similarity to withdrawals and deposits. Water taken out of the soil must be made up with either rainfall or irrigation or the soil reservoir will become dry.
Good irrigation scheduling means applying the right amount of water at the right time---in other words, making sure water is available when the crop needs it. Scheduling maximizes irrigation efficiency by minimizing runoff and percolation losses. This often results in lower energy and water use and optimum crop yields, but can result in increased energy and water use in situations where water was not being properly managed.
Soil Water Storage Capacities
<back to top>
The texture of soil to be irrigated is very important in determining when and how much to irrigate. This table lists the abilities of different soil types to store and make water available to plants.
| Soil | Available Moisture per foot |
|
| General Description | Texture Class | |
| Light, Sandy | Coarse Sand | 0.7 inches |
| Fine Sand | 0.9 | |
| Sandy Loam | 1.2 | |
| Medium, Loamy | Fine Sandy Loam | 1.5 |
| Loam | 1.8 | |
| Silt Loam | 2.0 | |
| Heavy, Clay | Clay Loam | 2.2 |
| Clays; Peats/mucks | 2.4 | |
*Values are for deep, uniform soil profiles. Layering or changes in soil texture within the profile may increase or decrease effective available water
Root Zone Depths for Selected Crops
<back to top>
The plant root zone determines the soil depth from which the crop can draw moisture. This table shows the root zones that mature crops depend on for 90% of their water needs, and the percent of total available moisture that crops can withdraw without suffering stress or yield loss.
| Crop | Root Zone* (ft) |
Time to Reach Mature Root Zone |
Allowable Depletion(%) |
| Alfalfa | 4.0 | 0 | 60 |
| Pasture/turf | 2.0 | 0 | 50 |
| Small Grains | 3.0 | heading | 50 |
| Beans | 2.5 | 50 days after plant | 50 |
| Corn | 3.0 | 10 days after tassel | 50 |
| Potatoes | 2.0 | 80 days after plant | 50 |
| Sugar Beets | 3.0 | 110 days after plant | 30-40 |
| Orchard | 3.0 | 0 | 50-65 |
| Grapes | 3.0 | 0 | 65 |
*Root zones can be limited by shallow soils, compaction layers and dry soil.
Nozzle Discharge vs. Pressure for Various Nozzle Sizes
<back to top>
| Nozzle Discharge - Gallons per Minute | ||||||||
| p.s.i. | 3/32 | 1/8 | 9/64 | 5/32 | 11/64 | 3/16 | 13/64 | 7/32 |
| 20 | 1.17 | 2.09 | 2.65 | 3.26 | 3.92 | 4.69 | 5.51 | 6.37 |
| 25 | 1.31 | 2.34 | 2.96 | 3.64 | 4.38 | 5.25 | 6.16 | 7.13 |
| 30 | 1.44 | 2.56 | 3.26 | 4.01 | 4.83 | 5.75 | 6.80 | 7.86 |
| 35 | 1.55 | 2.77 | 3.50 | 4.31 | 5.18 | 6.21 | 7.30 | 8.43 |
| 40 | 1.66 | 2.96 | 3.74 | 4.61 | 5.54 | 6.64 | 7.80 | 9.02 |
| 45 | 1.76 | 3.13 | 3.99 | 4.91 | 5.91 | 7.03 | 8.30 | 9.60 |
| 50 | 1.85 | 3.30 | 4.18 | 5.15 | 6.19 | 7.41 | 8.71 | 10.10 |
| 55 | 1.94 | 3.46 | 4.37 | 5.39 | 6.48 | 7.77 | 9.12 | 10.50 |
Irrigation Application - Inches per Hour
<back to top>
| Sprinkler Spacing |
Gallons Per Minute/Sprinkler | ||||||||||||||
| 2 | 3 | 4 | 5 | 6 | 7 | 8 | 9 | 10 | 11 | 12 | 15 | 18 | 20 | 25 | |
| 30x30 | .21 | .32 | .43 | ||||||||||||
| 30x40 | .16 | .24 | .32 | .40 | .48 | .52 | .64 | .72 | |||||||
| 30x50 | .25 | .32 | .38 | .44 | .51 | .57 | .64 | .70 | .76 | ||||||
| 30x60 | .27 | .32 | .37 | .43 | .48 | .53 | .58 | .64 | .80 | ||||||
| 40x40 | .18 | .24 | .30 | .36 | .42 | .48 | .54 | ||||||||
| 40x50 | .24 | .29 | .33 | .38 | .43 | .48 | .53 | .58 | |||||||
| 40x60 | .20 | .24 | .28 | .32 | .36 | .40 | .44 | .48 | .60 | .72 | .80 | ||||
| 50x50 | .23 | .27 | .31 | .35 | |||||||||||
| 50x60 | .19 | .22 | .26 | .29 | .32 | .35 | .39 | .48 | .58 | .64 | |||||
| 50x70 | .19 | .22 | .25 | .28 | .30 | .33 | .41 | .49 | .55 | .69 | |||||
| 60x60 | .21 | .24 | .27 | .29 | .32 | .40 | .48 | .53 | .67 | ||||||
| 60x70 | .20 | .23 | .25 | .27 | .34 | .41 | .46 | .57 | |||||||
| 60x80 | .20 | .22 | .24 | .30 | .36 | .40 | .50 | ||||||||
Wire-to-Water Pump Efficiency
<back to top>
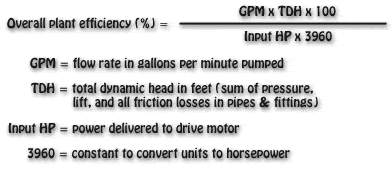
The overall or "wire-to-water" efficiency of a pumping plant is the ratio of work done by a pumping plant to the energy put into the pump. The pumping plant is defined as the pump and motor plus all associated fittings from the water source through the pump to the discharge into the irrigation distribution system. Efficiency is expressed by the following equation:


