- Reclamation
- Missouri Basin and Arkansas-Rio Grande-Texas Gulf
- HydroMet
- Annual Cumulative and Historical Average Plots (QNAPLT)
Annual Cumulative and Historical Average Plots (QNAPLT)
QNAPLT allows the user to plot cumulative daily data and average cumulative daily data in addition to the normal plotting of the daily values themselves under the regular plotting routines. Cumulative daily data are accumulated over a specified period as defined by the user and averaged cumulative daily data are computed for a specified period of years as requested by the user.
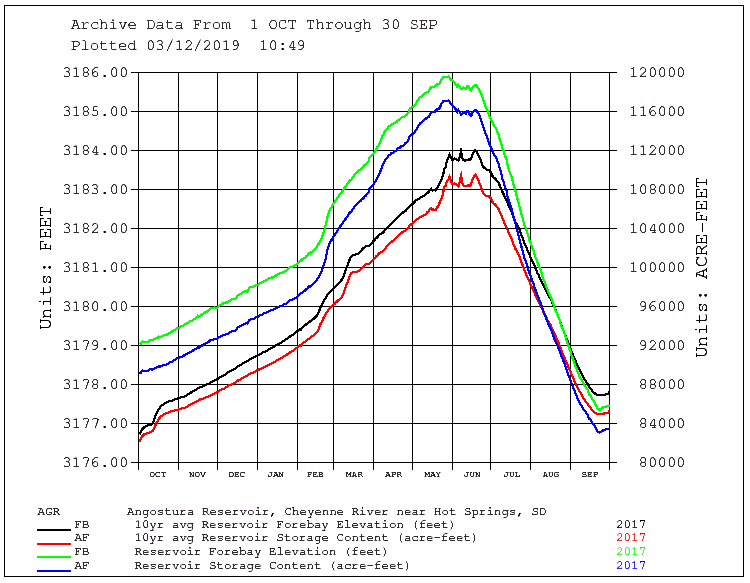
An example of the output plot for this page featuring 2017 reservoir storage, 2017 elevation, 10 year average reservoir storage, and 10 year average
elevation for Angostura Reservoir.
For further information contact: MBWebmaster


