Inflow Plot (INFPL1)

Inflow computations calculate inflows to reservoirs using storage, elevation, and discharge data. This page plots the calculated inflow data. Additionally, sliding averages for inflows can be calculated.

Site and Date Information

  • Year: Month: Day:
  • Number of days:
  • Storage station:
  • Outflow station:
  • Outflow parameter code:

At least one of the next four plot options must be set to Yes to generate a plot.

  • Do you want to plot storage:
  • Do you want to plot outflow:
  • Do you want to plot the 1 hour averaged inflows:
  • Do you want to plot a running average:
    • Hour interval for running average:
      - if > 0 average will be a "sliding window" average over the period (interval * multiple)
      - if = 0 no sliding average will be computed.
  • Do you want to plot a second running average (At least one of the top three plot options must be No and plot a running average must be Yes):
    • Hour interval for second running average:
      - if > 0 average will be a "sliding window" average over the period (interval * multiple)
      - if = 0 no sliding average will be computed.

Plot Scale Override

  • Over-ride automatic plot scale limits for flow data:
  • Top scale limit in CFS (Needed if Over-ride is Yes):  
  • Bottom scale limit in CFS (Needed if Over-ride is Yes):  

  Select this box for a full size version which can be printed.


An example of the output plot for this page featuring reservoir storage, inflow, and outflow for Angostura Reservoir.
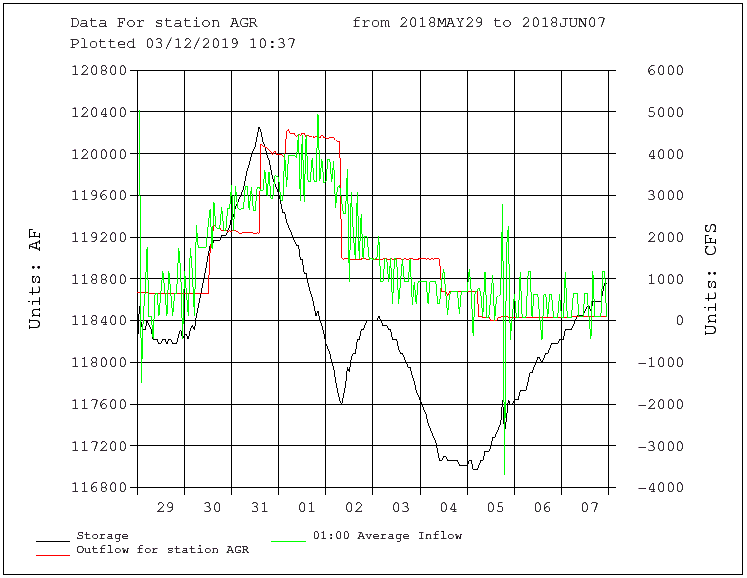
An example of the output plot for this page featuring reservoir storage and outflow for Angostura Reservoir.


For further information contact: MBWebmaster
Last Updated: 8/5/20