Plot Multiple Years of Data for up to 3 Station/Parameter Combintations (AMYPLT)

This form plots up to 10 years of daily data for up to three station/parameter codes. Enter the beginning and ending dates for the plot.

Beginning month     Beginning day     Ending month     Ending day  

Beginning year      Years to plot   

  Station Parameter
(1)
(2)
(3)

Vertical Plot Scale Limits (optional, leaving blank is recommended)

Left upper limit     Left lower limit  

Right upper limit   Right lower limit

Select this box for a full size version which can be printed.

An example of the output plot for this page featuring reservoir storage content for Bighorn Reservoir.
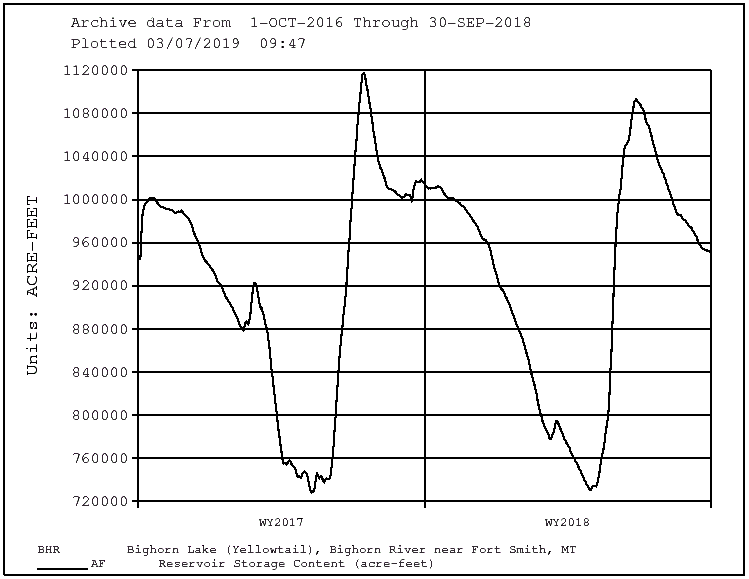
An example of the output plot for this page featuring reservoir storage content for Bighorn Reservoir.

For further information contact: MBWebmaster
Last Updated: 8/5/20