River Basin Tea-Cup Diagrams
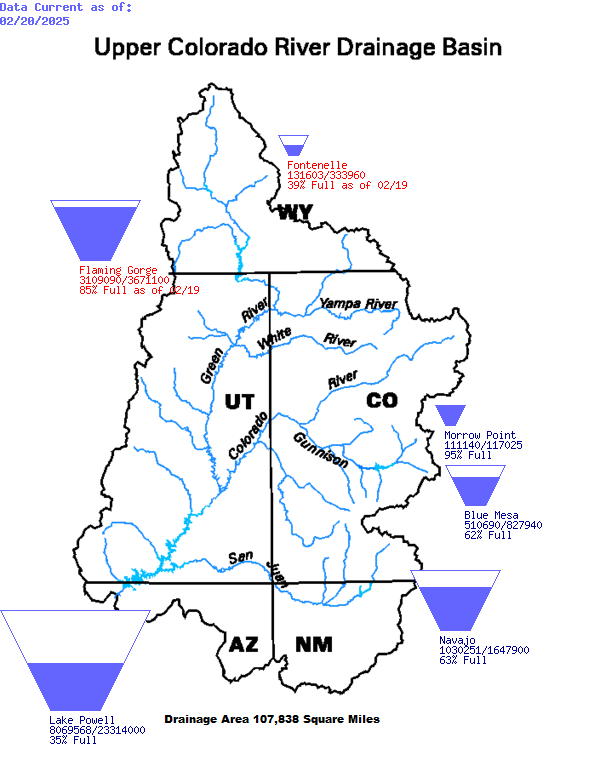
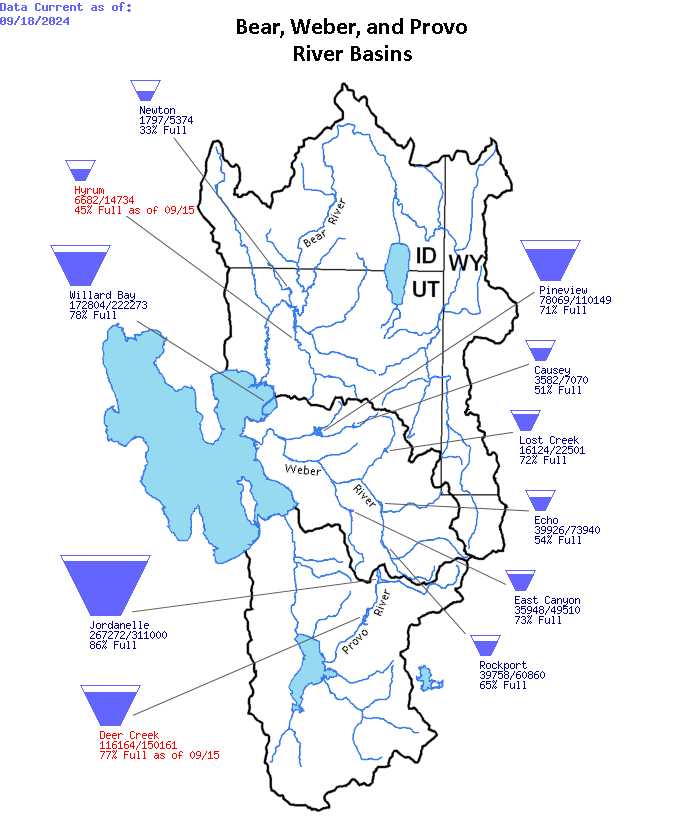
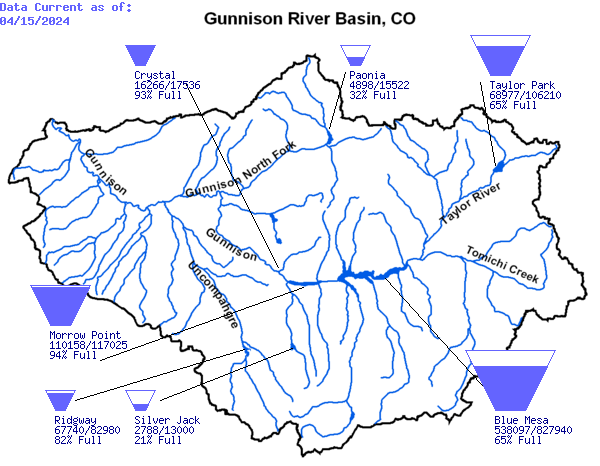
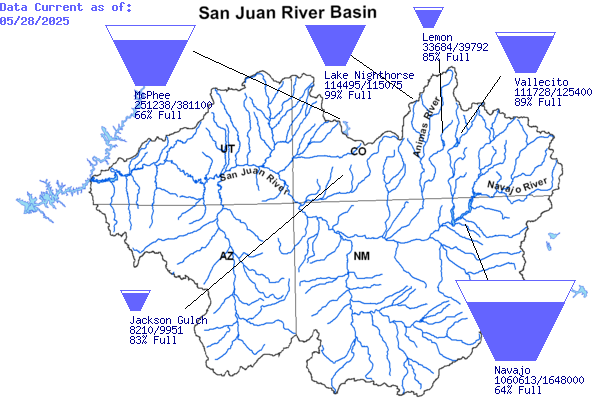
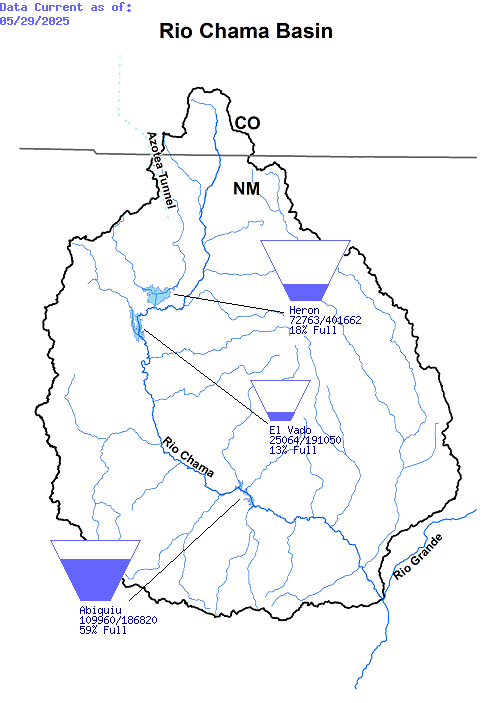
 By selecting one of the river basin tabs below, you will be shown a map of that basin. Each of the major Reclamation Reservoirs in the basin will be represented by a Tea-Cup Diagram, such as the example seen at left. The level of blue fill in the Tea-Cup represents the level of fill in the reservoir. The storage volumes reported represent the live storage, which is the storage that can be withdrawn by gravity. Reservoir storage exists in addition to the live storage amounts but is unable to be withdrawn by gravity through normal operations. Storage may be limited further based on reservoir operating requirements for diversion purposes and those regulations are not included here. Below the Tea-Cup you will find the name of the reservoir, a ratio of the volume of water currently in the reservoir to the volume of water in the reservoir when it is full, and the percent full. The data represented is checked for accuracy, however all data is subject to revision.
- Upper Colorado River Basin
- Wasatch Front River Basins
- Gunnison River Basin
- San Juan River Basin
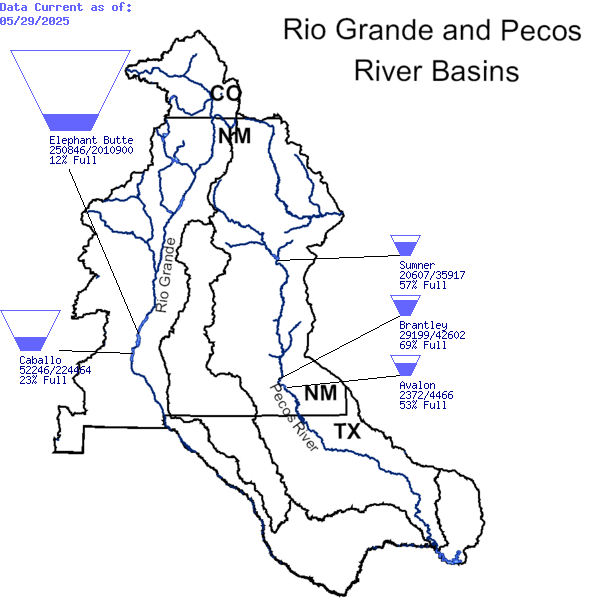
- Pecos River-Rio Grande Basins
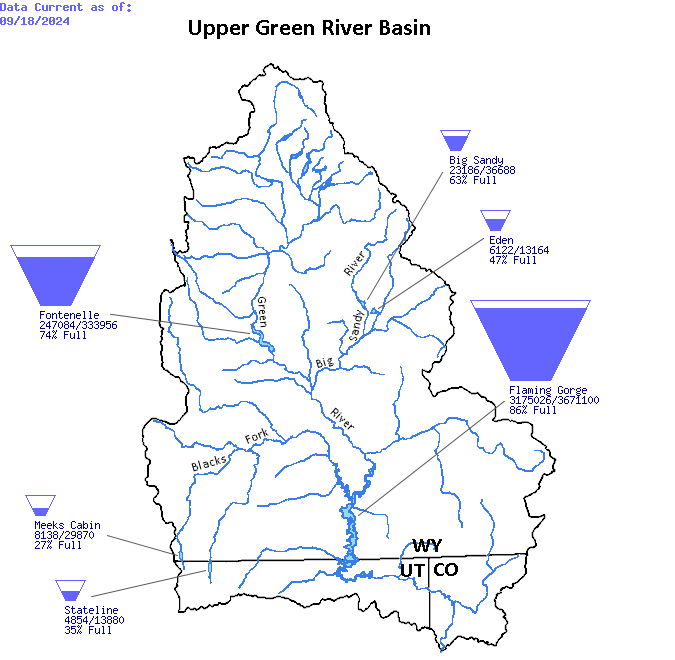
- Green River Basin
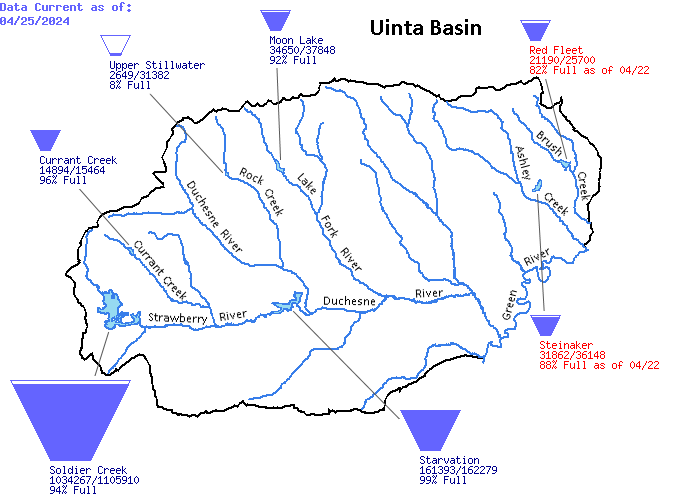
- Uinta Basin
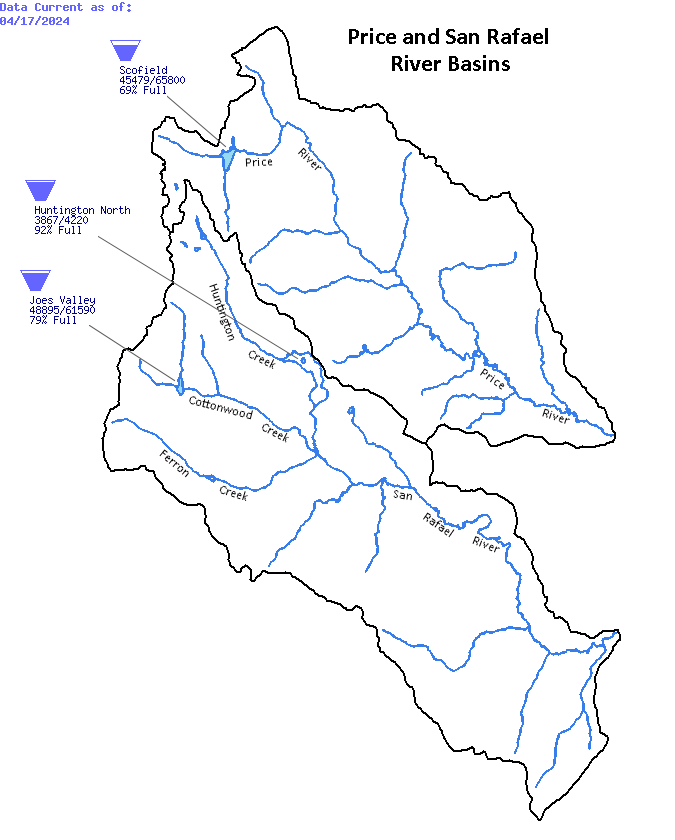
- Price/San Rafael River Basin
- Rio Chama Basin
Please contact the Operations Group via e-mail at ResourceMgr@usbr.gov for additional questions or information.
Last Updated: 9/2/22
