- Reclamation
- California-Great Basin
- Area Offices
- BDO
- Projects and Activities
- Bay-Delta Flow & Water Quality Monitoring Network
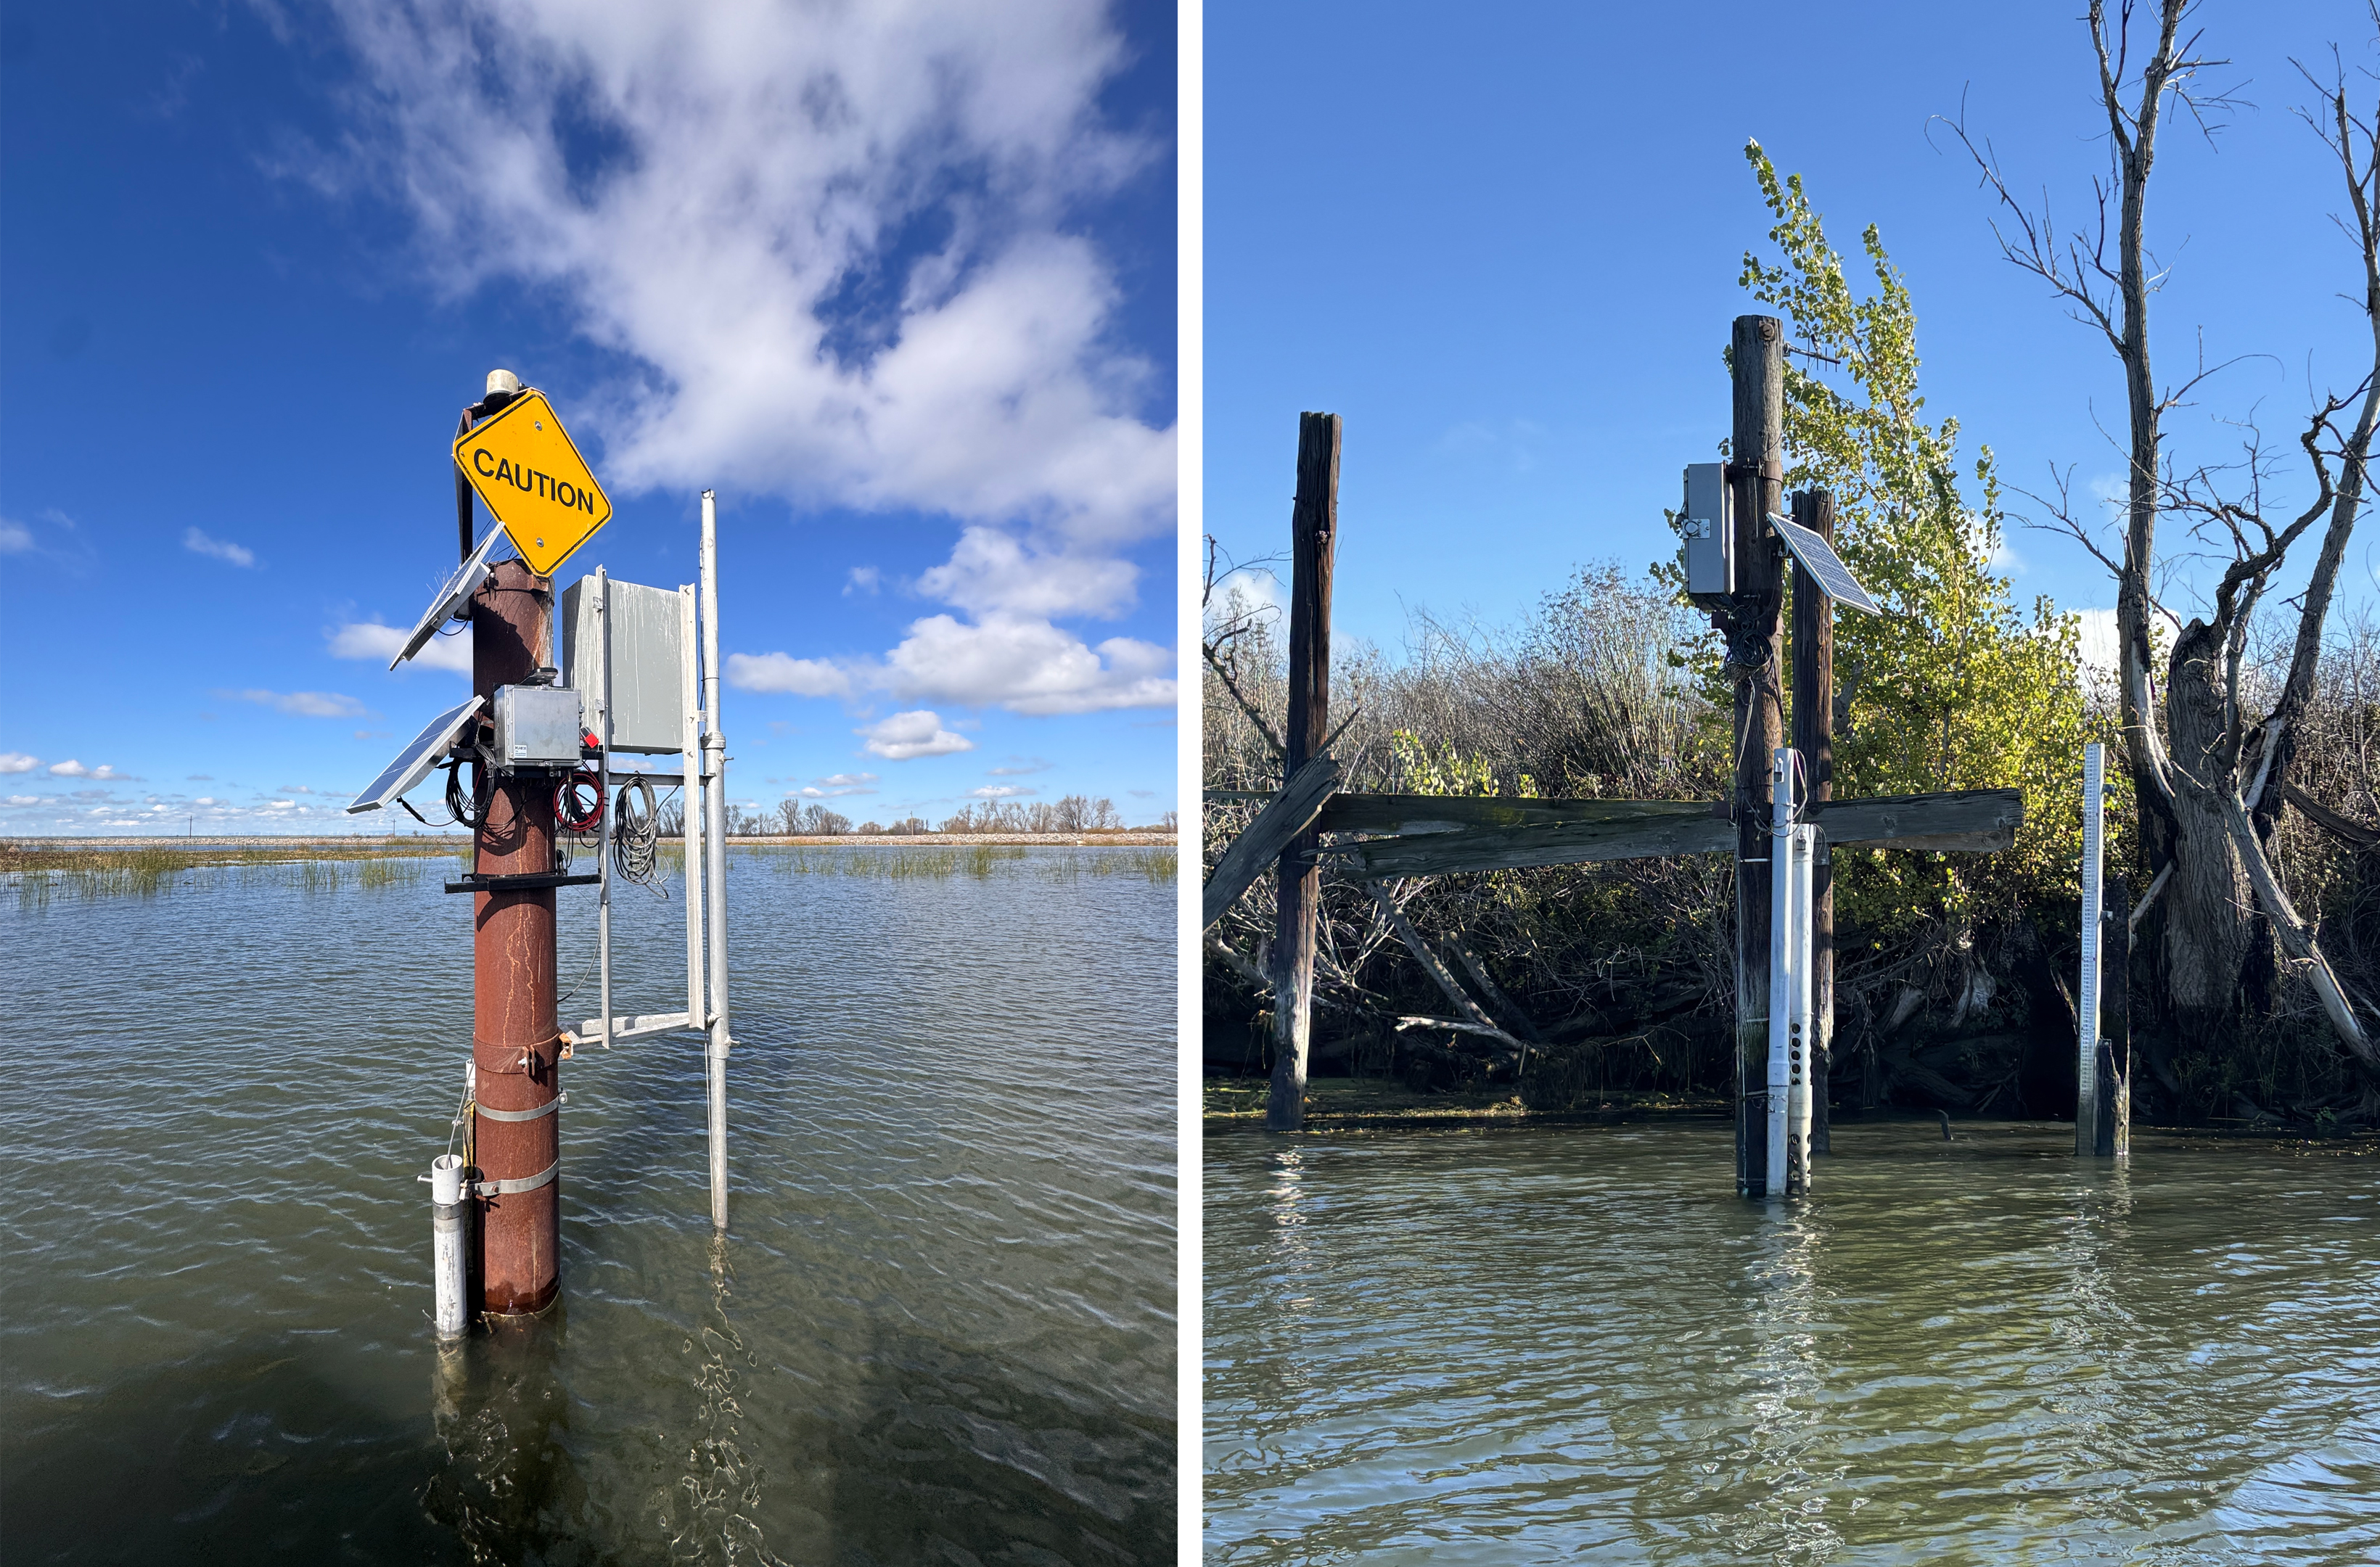
Bay-Delta Flow & Water Quality Monitoring Network
Background:
Reclamation operates and maintains the Central Valley Project (CVP) for the purposes of navigation and flood control; fish and wildlife mitigation, protection, restoration, and enhancement; agricultural and municipal and industrial water supply; power generation; and recreation. Reclamation’s mission is to perform these functions in an environmentally and economically responsible manner. To carry out this mission, Reclamation requires accurate and reliable data and information on the hydrodynamic, water quality, and biogeochemical properties of the Sacramento-San Joaquin Delta (Delta) and Suisun Bay. Observational environmental data are used for: (i) real-time operation of CVP facilities, (ii) documenting long-term status and trend measures of Delta ecosystem responses to hydrologic conditions, CVP operations and habitat restoration actions, and (iii) calibrating and validating hydrodynamic, sediment transport, biogeochemical, and ecological models.
The data collected from the Bay-Delta flow & water quality monitoring network include:
continuous flow (discharge and velocity) and water level data that provides information about transport, mixing processes and water residence times.

Continuous measurements include temperature, specific conductance, turbidity, dissolved oxygen, pH, chlorophyll, dissolved organic matter, & nutrients influencing biogeochemical processes such as transformation rates, aquatic productivity, & zooplankton growth. Discrete samples for nutrients are also collected for sensor calibration & to analyze additional parameters.
the collection of discrete samples analyzed for phytoplankton enumeration, as well as continuous deployment of multiparameter fluoroprobes that measure pigments of various phytoplankton species. This information helps build understanding of phytoplankton community composition and dynamics that can inform science and management of beneficial and harmful algal blooms.
discrete monitoring to assess suspended sediment distribution across the region and to transform turbidity data into suspended sediment concentration to compute suspended sediment fluxes for numerical modeling.
What activities are undertaken to maintain the network?
- Calibrating, maintaining, and managing data following standard operating procedures consistent with, or exceeding, historic protocols for the network.
- Making real-time data publicly available through CDEC and downloaded data available via Reclamation dashboards (please contact BDO for more information).
- Developing and modifying flow and sediment rating curves. This process will require one to three years of data collection. Until new rating curves are developed and validated, flow and sediment data will remain provisional.
- Planning and permitting updates to stations.
- Please see additional details in update documents and/or reports below.
Stations included in this monitoring network:
A list of stations and the constituents measured are in Table 1. Information includes the full station name, the CDEC station ID (linked directly to CDEC station page where possible), the coordinates, and the data types for hydrology, water quality, and sediment. For water quality data, categories indicate whether stations measure temperature (Temp), specific conductivity (SpC), and turbidity (Turb); all water quality consituents (All WQ; temperature, specific conductivity, turbidity, pH, dissolved oxygen, chlorophyll a fluorescence, and fluorescence of dissolved organic matter); all water quality and nutrients (Nutr; SUNA nitrate measurements and nutrient sample collection); or all water quality consituents, nutrients, and fluoroprobe measurements. Italicized stations’ infrastructure was destroyed in Summer 2025, so are not currently active.
Table 1.
Station Name |
CDEC Station ID |
Latitude |
Longitude |
Flow |
Water Quality |
Sediment |
Sacramento River Deep Water Ship Channel, Channel Marker 51 (CM 51) |
38.23739 |
-121.674 |
Flow |
All WQ |
Delta |
|
Sacramento River Deep Water Ship Channel near Courtland (CM 62) |
38.34167 |
-121.644 |
All WQ + Nutr |
|
||
Sacramento River Deep Water Ship Channel near Freeport (CM 72) |
38.47687 |
-121.584 |
Flow |
All WQ + Nutr |
|
|
Channel Marker 49A |
CM49A |
38.23333 |
-121.675 |
Flow |
All WQ + Nutr |
Delta |
Suisun Bay at Van Sickle Island near Pittsburg, CA |
CONFL |
38.04953 |
-121.888 |
All WQ + Nutr + Fluoroprobe |
|
|
Delta Cross Channel near Walnut Grove, CA |
38.24472 |
-121.505 |
Flow |
All WQ |
||
Dutch Slough below Jersey Island Road at Jersey Island |
38.01361 |
-121.667 |
Temp + SpC + Turb |
|
||
False River near Oakley, CA |
38.05583 |
-121.667 |
Flow |
Delta |
||
Sacramento River below Georgiana Slough, CA |
38.23889 |
-121.522 |
Temp + SpC + Turb |
|
||
Grant Line Canal near Tracy, CA |
37.82 |
-121.545 |
Delta |
|||
Grizzly Bay at Suisun Slough near Avon, CA |
38.10853 |
-122.056 |
All WQ + Nutr |
|
||
Georgiana Slough near Sacramento River |
38.23722 |
-121.518 |
Flow |
Temp + SpC + Turb |
Delta |
|
Middle River near Holt, CA |
38.00306 |
-121.511 |
Flow |
Delta |
||
Holland Cut near Bethel Island, CA |
38.01639 |
-121.582 |
Flow |
Delta |
||
Cache Slough at Liberty Island near Rio Vista, CA |
38.24222 |
-121.686 |
Vel |
All WQ + Nutr |
Delta |
|
Little Potato Slough at Terminous, CA |
38.09639 |
-121.496 |
Flow |
All WQ + Nutr |
|
|
Sacramento River below Toland Landing near Rio Vista, CA (CM 13) |
38.07781 |
-121.767 |
Vel |
All WQ + Nutr + Fluoroprobe |
|
|
Sacramento River Deep Water Ship Channel near Clarksburg (CM 66) |
38.40444 |
-121.615 |
All WQ |
|||
Middle River at Middle River, CA |
37.94278 |
-121.533 |
All WQ + Nutr + Fluoroprobe |
|
||
Miner Slough near Sacramento River and Prospect Island |
38.23556 |
-121.666 |
Delta |
|||
Suisun Bay at Mallard Island, CA (top and bottom station) |
38.04278 |
-121.919 |
Temp + SpC + Turb |
Bay |
||
Mokelumne River at at Andrus Island near Terminous, CA |
38.10611 |
-121.571 |
Flow |
Delta |
||
North Mokelumne River near Walnut Grove, CA |
38.22333 |
-121.507 |
Flow |
Temp + SpC + Turb |
Delta |
|
Old River at Bacon Island, CA |
37.97 |
-121.571 |
All WQ + Nutr + Fluoroprobe |
|
||
Old River near Delta Mendota Canal, CA |
37.81056 |
-121.541 |
Delta |
|||
Old River near Byron, CA |
37.89111 |
-121.569 |
Temp + SpC + Turb |
Delta |
||
Old River at Quimby Island near Bethel Island, CA |
38.02722 |
-121.564 |
Flow |
Delta |
||
Old River at Franks Tract near Terminous, CA |
38.07111 |
-121.579 |
Flow |
Delta |
||
San Joaquin River at Prisoner's Point near Terminous, CA |
38.05944 |
-121.557 |
Flow |
Delta |
||
Cache Slough above Ryer Island Ferry near Rio Vista, CA |
38.19396 |
-121.658 |
Flow |
All WQ + Nutr |
Delta |
|
Sacramento River above Delta Cross Channel, CA |
38.25778 |
-121.517 |
All WQ + Nutr |
|
||
Shag Slough at Liberty Island near Courtland, CA |
38.31833 |
-121.693 |
Flow |
All WQ + Nutr |
Delta |
|
San Joaquin River below Garwood Bridge at Stockton, CA |
37.93556 |
-121.329 |
Flow |
Temp + SpC + Turb |
Delta |
|
San Joaquin River West at Jersey Point, CA |
38.05222 |
-121.688 |
All WQ + Nutr + Fluoroprobe |
Delta |
||
South Mokelumne River at New Hope Bridge near Walnut Grove, CA |
38.22556 |
-121.491 |
Flow |
Temp + SpC + Turb |
Delta |
|
Sacramento River at Rio Vista, CA |
38.14904 |
-121.689 |
Delta |
|||
Steamboat Slough near Walnut Grove, CA |
38.28472 |
-121.587 |
Flow |
|||
Sutter Slough at Courtland, CA |
38.32917 |
-121.579 |
Flow |
|||
Toe Drain at Mallard Road near Courtland, CA |
38.34917 |
-121.6447 |
Flow |
All WQ + Nutr |
Delta |
|
Turner Cut near Holt, CA |
37.9925 |
-121.454 |
Flow |
Delta |
||
Threemile Slough near Rio Vista, CA |
38.10333 |
-121.686 |
Delta |
|||
Victoria Canal near Byron, CA |
37.87083 |
-121.53 |
Flow |
Delta |
||
Yolo Bypass near Woodland, CA |
38.67778 |
-121.643 |
Turb |
Delta |
Station Map
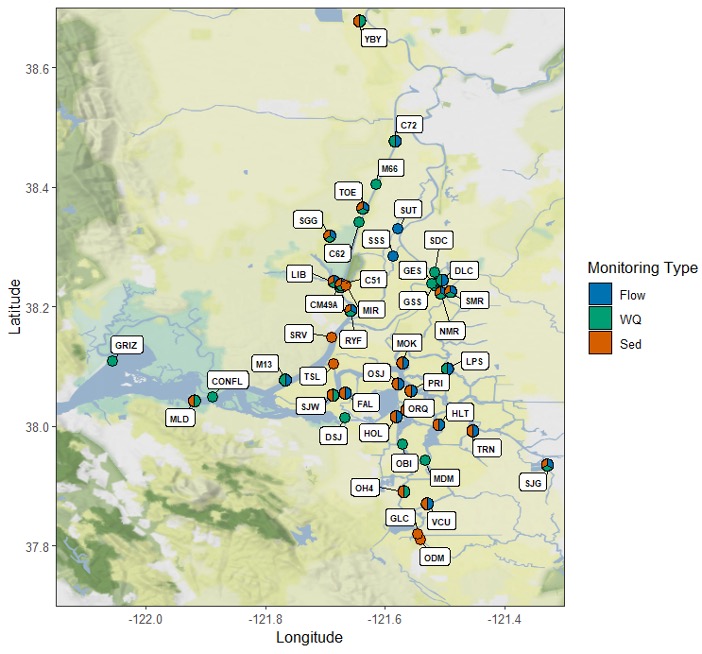
Figure 1. Map of monitoring stations in this network. Stations either measure flow (discharge and/or velocity; blue points), water quality (WQ; combinations of temperature, specific conductivity, turbidity, dissolved oxygen, pH, chlorophyll a fluorescence, dissolved organic matter fluorescence, nutrients, and phytoplankton pigments; green points), and/or suspended sediment (orange points). Details about specific constituents measured and station abbreviations can be found in Table 1.
