- Reclamation
- Missouri Basin and Arkansas-Rio Grande-Texas Gulf
- Nebraska-Kansas Area Office
- Frenchman Unit Draft Appraisal Report
Needs Assessment – MR&I Water System, Santee Indian Reservation, Nebraska – March 2004
See Also, Santee Bulletin, (Information Background Sheet, Feasibility Study)
Table of Contents:
- Reservation Lands
- History and Background
- Establishment of the Santee Reservation and Current Conditions
- Climate
- Drainage and Landform
Chapter 3: Community Services and Infrastructure
- Public Health and Welfare
Chapter 4: Current Economic Conditions
- Unemployment, Income, and Poverty
- Current Commercial and Industrial Activity
- Future Economic Growth
Chapter 5: Santee Indian Reservation Base Population and Population Projections
- Base Population
- Population Projections
- Preface
- Findings
Chapter 7: Water Resource Evaluation
- Bazile Creek Well Field
- Missouri River Alluvium
- Scattered Individual Wells
- Springs South of the Village of Santee
- Alluvium in Southeast Reservation
Chapter 8: Water Supply and Treatment
- Village of Santee System
- Lakeside Community
- Highway 12 Housing Project
- Howe Creek Community
- Rural Tribal Lands
- Assessment
- Representative Water Quality by Aquifer and Region Within the Reservation
Chapter 9: Estimate of Future Water Demands
- Future Water Demands
- Assessment
Chapter 10: Reservationwide Water Supply Alternatives
- Cost Estimates
- Fire Flow
- Treated Water Storage
- Alternatives 1 thru 6
Chapter 11: Wastewater Treatment
The Santee Indian Reservation (Reservation) lies in the north-central part of Knox County in northeastern Nebraska (figure S-1). The Reservation border is marked by Lewis and Clark Lake and the Missouri River to the north and boundary lines to the east, west, and south. The resident population is centered in the Village of Santee (Village) in the northernmost portion of the Reservation. The nearest off-Reservation towns are Niobrara, Nebraska, and Yankton, South Dakota, about 12 miles southwest and 30 miles northeast of the Village, respectively.
Employment on the Reservation is concentrated in the agricultural, service, and administrative support sectors. Most of the jobs in these sectors are relatively low paying. Some revenue is by tourism, outdoor recreation, and casino gambling. Unemployment is much higher and income much lower on the Reservation than for the rest of Know County and for all of Nebraska. Future economic growth is anticipated for agricultural and service industries as well as recreation and community based enterprises. Potential future development includes a small strip mall, an RV park, casino expansion, a hotel, and possibly a golf course. A light industry establishment is also desired on the Reservation. The bridge crossing the Missouri River just west of the Reservation provides a good transportation link to Yankton, South Dakota which will help support future growth in the area.
Despite relatively high unemployment and low incomes experienced on the Reservation, long-term population growth is anticipated because of the desire of the Santee people to remain on the Reservation, potential in-migration of enrolled tribal members not currently living on the Reservation, and the relatively young population of the Reservation. An additional factor is the potential for future economic development on the Reservation. As a result, the Reservation population is projected to grow at an average annual rate of 1.84 percent through the year 2050 assuming a net Indian migration rate of 1 percent annually. The Village of Santee is projected to grow at a 1.3 percent annual rate and nearby Center is projected to grow at a 1.8 percent annual rate. Niobrara is projected to lose population over the 50 year period, at a rate of about 0.35 percent annually.
Currently, Reservation water supplies are drawn almost entirely from ground-water sources. Major aquifers being used include Quaternary alluvial materials adjacent to major stream channels (or associated with buried stream channels), the Dakota Formation, and Quaternary deposits in the southeast sector of the Reservation.
The Quaternary alluvial aquifers consist of unconsolidated sand and gravel deposits interbedded with silt and clay. Well yields from these deposits can vary significantly (from 50 to 750 gallons per minute). Depending on recharge from adjacent formations and overlying streams, water quality can vary considerably. On the basis of limited data, however, the quality of water from the Quaternary alluvial aquifers is more suitable for most residential and commercial purposes than water from the Dakota Formation. Work being conducted by the Santee Sioux Nation and Dr. Ralph Davis of the University of Arkansas, Fayetteville, under the U.S. Environmental Protection Agency (U.S. EPA) Title 106 Water Quality Management Program, will aid in linking ground-water quality with specific aquifers on the Reservation.
Figure S-1. Location of the Santee Sioux Reservation.
The Dakota Formation is composed of interbedded sandstone and claystone. Depth to the top of the formation ranges from 800 to 1,000 feet; yields range from 50 to 500 gallons per minute. Water quality is generally poor, suffering from high total dissolved solids, sulfate, iron, and manganese. The U.S. Geological Survey (USGS) theorized that seepage from the Dakota Formation into the overlying Quaternary alluvium is responsible for the elevated levels of these constituents that are found in most Reservation water supplies.
Preliminary findings from U.S. EPA Title 106 Water Quality Management Program studies in progress on the Reservation indicate that pesticides do not appear to be an immediate problem for Reservation domestic ground-water supplies. On the other hand, nitrate-nitrogen and total coliform bacteria appear to exceed U.S. EPA primary drinking water standards in a significant number of wells. It is tentatively concluded that the offending contaminant source is related to septic system effluent or onsite confined animal feeding operations, rather than to agricultural nonpoint pollution.
Without question, adequate supplies of good quality water are essential for supporting local economic growth and for enhancing quality of life on the Reservation. Although not perceived as a direct health risk, poor quality water delivered to the Village, cluster projects, and many rural areas imposes economic constraints on the Reservation. To this end, six Reservationwide water supply alternatives are presented in this report to illustrate the range of water supply options (and costs) that could be considered in future planning endeavors. Alternatives were included that draw water either from surface and ground-water sources or that tie into rural water authority systems in close proximity to the Reservation. Wastewater facilities that would be necessary to accommodate increased flow from an expanded water supply network are briefly addressed.
In-depth comparison and detailed engineering design of water supply alternatives for the Reservation constitute the next level of planning.
Background
The Santee Indian Reservation was established by Presidential Executive Order of February 27, 1866. The Reservation covers approximately 184 square miles (approximately 117,000 acres) in the north-central part of Knox County in northeastern Nebraska (figure S-1). Lewis and Clark Lake and the Missouri River form the northern boundary of the Reservation. Most of the residents are in the northern half of the Reservation in the Village. The nearest off-Reservation towns are Niobrara, Nebraska (12 miles southwest of the Village), Yankton, South Dakota (about 30 miles northeast of the Village), and the city of Center, located south of the Reservation boundary.
Several comprehensive reports have been prepared that address the water resources of the Reservation. These include two reports from B&E Engineering, Inc., of Yankton, South Dakota, entitled, “Water Resource Inventory, Santee Indian Reservation” (Phase I, 1978, and Phase II, 1981) and the U.S. Department of the Interior, USGS 1995 administrative report entitled, “Physical Characteristics and Water-Resources Appraisal of the Santee Indian Reservation in Northeastern Nebraska.” Much of the information and physical setting description used in this report was excerpted from these documents. More recent work includes three reports prepared as part of ongoing Santee Sioux Nation environmental programs, entitled (1) “Baseline Assessment of Water Quality on the Santee Sioux Reservation 1996-1997 and Framework for Tribal Water Quality Management Plan,” (2) “Assessment of Water Quality on the Santee Sioux Reservation May 1998 - March 1999 and Tribal Water Quality Management Plan,” and (3) “Hydrogeologic Assessment of the Bazile Creek Wellfield and the Potential Southeast Well Field.” Only minimal information was found regarding yields of existing wells and aquifers on the Reservation. As such, yield capability of existing individual and community wells is addressed only peripherally in the report. However, the recent report on the Bazile Creek well field and the aquifer underlying the southeast corner of the Reservation does include modeled yield potential for these aquifers.
The chapters that follow discuss the Reservation’s cultural setting, resource setting, community services and infrastructure, current economic conditions, base population and population projections, water quality, water resource evaluation, water supply and treatment, estimate of future water demands, water supply alternatives, and wastewater treatment. Attachments 1-5 include appraisal grade cost estimates for developed alternatives, the US Filter Proposal, and supporting information from Cedar-Knox Rural Water Project and West Knox Rural Water System.
Study Objectives
In developing this report, items that typically are included in a water needs assessment were addressed in the context of water supply and water quality issues of immediate concern to the Santee Sioux Nation (Santee Nation). Tribal concerns were conveyed to the Bureau of Reclamation (Reclamation) in numerous planning meetings and revisited at intervals during the course of the study. Included were the following:
- Sedimentation and deteriorating conditions at the Bazile Creek well field
- Poor water quality and yield of wells on eastern portions of the Reservation
- Pesticide contamination of potable water sources
- Treatment and storage capabilities of the current water system
- Viability of a Reservationwide water supply and distribution system, including possible sale of water to the off-Reservation towns of Niobrara and Center
Authority and Funding
This study was performed under authority of the Federal Reclamation Act of June 17, 1902, as amended. Funding was provided through Reclamation’s Technical Assistance to States and Native American Affairs Program.
Cultural Setting
This chapter provides a historical and background summary to promote an understanding of the current cultural, social, and economic conditions and needs on the Santee Indian Reservation (Reservation).
Reservation Lands
The Santee Indian Reservation covers an area of about 115,000 acres. The large majority of the Reservation land is owned by non-Indians, with about 10 percent tribally owned or individually allotted. Tribal and allotted lands are interspersed with non-Indian lands on the Reservation (figure S-1 in the Executive Summary).
History and Background
The Dakota people occupied a vast area of what is now southern Canada, western Michigan, Minnesota, Wisconsin, Illinois, Iowa, and northeastern Missouri. This land had many marshes, lakes, and rivers that supported abundant and diverse plant and animal life. The diet of the Dakota people was mainly wild rice, berries, fish, and timber game until they were forced onto the prairies, where their diet was principally buffalo. In the mid-1600s and 1700s, when contact with missionaries, explorers, and French traders occurred, the Nakota and Dakota were mainly in Minnesota, although they sometimes hunted in the Des Moines River headwaters or along the Big Sioux River. By the late 1700s, they were hunting more regularly along the upper Des Moines and Cedar Rivers.
In 1825, the Nakota and Dakota agreed to a treaty of peace with the Sauk and Meskwaki that restricted them somewhat to an area mostly north of Iowa, in Minnesota. The peace treaty was meant to end Yankton and Santee occupancy of Iowa. Further treaties during the mid- to late1800s, however, were imposed to confirm the Yankton and Santee relinquishment of land claims in Iowa and Minnesota.
The Santee Sioux Nation is part of the Dakota-speaking branch of the Sioux Nation. In the English language, Dakota translates to mean “allies” or “friends.” The name Santee stems from the original “Isanyanti” (Isanti), which is a Dakota word that translates loosely as “knife people dwellers.” The Dakota Nation consists of four distinct bands: Mdewakantonwan (Spirit Lake Dwellers), Sisitonwan (Fisher’s Camp), Wahpeton (Leaf Dwellers), and the Wahpekute (Shoot the Leaf). A woodland Tribe, the Santee lived in permanent villages in Minnesota and engaged in agriculture and farming for much of the year. Hunts were conducted twice a year. During hunting and food gathering season, they roamed vast areas, moving their camps often. Because the Dakota resided primarily along the boundary of the Sioux Nation, which ranged from Minnesota to the northern Rocky Mountains in Montana and south through the northwestern part of Nebraska, they became known as the “frontier guardians of the Sioux Nation.”
The recorded history of the Santee Sioux began when French explorers encountered the Mdewakantonwan band of the Dakota Nation in Minnesota in 1658. Most of the Santee history before that encounter was passed on orally. Beginning in the early 1800s and continuing through most of that century, white settlers moved into territory occupied by the Sioux.
In 1854, an Act passed by the Congress allowed the President to confirm an area in what is now South Dakota, western Minnesota, Iowa, and North Dakota to be reserved for the Sisitonwan, Wahpeton, Mdewakantonwan, and Wahpekute bands. Friction began to grow between the Santee, the United States Government, and the white settlers. Mistrust felt by settlers and the Santee led to isolated outbreaks of violence. In 1862, the friction reached an explosive stage and, as a result, the four bands took part in an uprising in western Minnesota. The Santee were forced to surrender under the overpowering attack of the U.S. troops. Because of this short-lived uprising, 38 Santee were mass executed by hanging in Mankato, Minnesota, in December 1862, and others were sent to prison in Davenport, Iowa. This was the largest mass execution in the history of the United States.
Because of the uprising, all Santee Sioux lands within the State of Minnesota were forfeited to the United States and the removal of the remaining Santee Sioux Indians from the State of Minnesota began. They were exiled to a site in South Dakota along the Missouri River, 100 miles from Fort Randall and about 8 miles above Crow Creek (named Crow Creek Reservation). In 1864, over 1,300 Santee were placed at Crow Creek. Within 3 months, starvation and disease reduced the number to 1,000. Although the Crow Creek episode lasted only 3 years, it was an important period in the history of the Santee Sioux. Recognizing the unfeasibility of making Crow Creek a permanent Reservation site, the government decided to locate the Tribe in northeastern Nebraska.
On February 27, 1866, President Andrew Johnson’s Executive Order was issued, withdrawing from preemption and sale four townships (Union, Hill, Spade, and Harrison) that were to be used to establish the Santee Sioux Reservation. The 1868 Treaty of Fort Laramie, or the “Act of Divide,” determined the present Reservation boundaries, allowed land to be purchased by the Santee Normal Training School, and provided for the allotment of land to tribal members who desired to farm. The allotment was, “To each head of a family, one quarter of a section; to each single person over eighteen years, one eighth of a section; to each orphan child under eighteen years, one eighth of a section; to each other person under eighteen years of age now living, one sixteenth of a section.”
Over the next 15 years, allotments were made, although titles were issued years later. In the summer of 1869, the boundaries of the Santee Reservation became officially established. After several changes, inclusions, and withdrawals, the Santee Reservation became a compact, rectangular tract of land 12 miles from east to west, averaging about 15 miles from north to south, and encompassing about 115,076 acres. The chief advantage of the site was its plentiful timber and at least 2,000 acres of tillable land. The southern and eastern portions included some good agricultural grazing land.
Being low on the Missouri River, it was easy to send supplies to the area. The government decided that the site would allow the Santee Sioux to become self-supporting. A number of businesses operated in the Village of Santee (Village), including a machine shop, a sawmill, a physician’s office, warehouses, granaries, and others. A post office that was established during the 1860s remained open until 1956, when mail service was moved to Niobrara. At one time, a ferry that was powered by a horse treadmill was operated from Santee across the Missouri River. Later, the ferry had to cease operation because of water fluctuations in the river caused by the opening and closing of dams.
The education policies for American Indian children during this period were first developed by missionaries who wanted to christianize American Indians through general education programs. Churches were built during this period, and some, such as the Episcopal Church at Santee, are still in use today. Reverend Alfred Langley Riggs, D.D., was the key figure in forming a school on the Santee Reservation for the purpose of educating Native Americans to become missionaries to their own people. Riggs founded the Santee Normal Training School in 1870, only 1 year after the Santee Sioux establishment was finalized as an academy for training Native American teachers. The school had an enrollment of 111 students from the immediate area, and within a short period of time, students arrived from other Dakota Sioux communities.
The Santee Normal Training School greatly influenced the development of the Tribe during the latter decades of the 19th century. An important policy of the Santee Normal Training School was that instruction should take place in the Dakota language, especially in the teaching of theology. Riggs was strongly convinced of the importance of teaching in the Dakota language. As an educator and linguist, he understood that thought and philosophy were closely tied to the spoken Dakota words. The world view of the Dakota people was also reflected in the Dakota language. Even more important, in 1871, the Santee Normal Training School had set up a printing press and printed many materials in the Dakota language, including a newspaper called the Iapi Oaye—or “Word Carrier.” This newspaper was printed partly in English and partly in Dakota and was circulated to over 1,200 residents each week. Many works were also translated from English into the Dakota language. The most commonly used works were the Bible, hymnals, and other religious writings. These books are still used in some families today as a means of teaching the Dakota language because, when being read, Dakota is spoken in a slower rhythm. In summary, the printing, preservation, and continued use of the Dakota language was accomplished—perhaps inadvertently—by the missionaries through this school. One noted former student of the Santee Normal Training School is Dr. Charles Alexander Eastman, who started school not knowing the English language. He was able to learn English and compete successfully at Dartmouth College and, later, at Boston University, where he received a medical degree.
The government agencies were strongly opposed to the use of the Dakota language in classroom instruction at the Santee Normal Training School, but they gave aid in the form of food rations for those students who were not from Santee. Riggs then asked the government to subsidize the tuition payments of the students, which they agreed to do. This aid was continued and even increased from 1883 to 1893. The school initially included a shoe shop, carpenter shop, and blacksmith shop. By 1885, the school had increased to 18 buildings on 480 acres. Government agents continued to pressure Riggs to discontinue teaching in the Dakota language, saying that if he would not stop, they would withdraw their financial support. Riggs argued that the use of the Dakota language was “...indispensable to best instruction. Things, not names, are what the true teacher must grasp.” Government agent Janney said, “So long as they are educated in their native tongue, they are still Indian. And, as everyone knows, the primary aim of our Indian policy is to transform Indians into white men.” In spite of Riggs arguments for teaching in the native language, the government agents would not relent; eventually, government aid to the school was stopped altogether in 1893. The theological classes had to be suspended, as this course was held almost entirely in the Dakota language. The training of the interpreters had to be terminated too, as the government commissioners ordered. However, the school remained in operation until 1933.
A Presidential order required that all Reservation lands not allotted by April 15, 1885, would, on May 15, 1885, revert to public domain, thus opening the Reservation to white settlement. By April 15, 1885, about 72,000 acres had been divided into 853 allotments. About 42,000 acres were open to white settlement, and 1,300 acres were reserved for agency, school, and missionary use. Allotments were gradually leased or sold to non-Indian farmers until the amount of land controlled by the Santee was reduced to the present acreage.
From 1885 through 1934, the history of the Santee Sioux can be understood only in relation to the general treatment of Indians during the period. The Agency of the Santee Reservation closed in 1917, and government services were gradually withdrawn. The practice of leasing had reduced the holdings of Indian lands. The Indian Reorganization Act (IRA) of 1934 brought a change in Indian policy. The Act stopped the allotments and required the Secretary of the Interior to attempt to regain land lost during the allotment act. IRA also proclaimed the Congress to be supportive of Indian self-governance and the creation of tribal constitutions. Indian Tribes (historically and at present) are subject to acts of the Congress; however, since the passage of the Indian Education and Self-Determination Act of 1972, the Tribes have been given some measure of control over their internal affairs.
Establishment of the Santee Reservation and Current Conditions
The Reservation was established in 1866 from four townships reserved from sale for the Sisitonwan, Wahpeton, Mdewakantonwan, and Wahpekute Branch. Additions and changes have since been made by Executive Orders of July 1867, August 1869, and December 1873.
Currently, the Santee Nation is governed by a Tribal Council consisting of eight members: the chairman, vice-chairman, secretary, treasurer, and four council members, who are elected at large every 4 years. The Santee Sioux Tribal Council members are elected by the people to full-time positions: one member from the Santee District, one member from the Hobu Creek District, one member from the Howe Creek District, and one member from the Bazile Creek District. In addition to conducting routine tribal business, the Tribal Council provides the community with police, fire, and ambulance service, as well as other essential community services (Tiller Research, Inc., 1996).
During the early and middle 1960s, the Reservation population dipped below 300. However, between 1970 and 1980, the trend reversed and the population expanded about fourfold. One reason for the expansion was increased Federal funding for Reservation projects and programs (particularly housing) that created jobs and attracted people back to the Reservation. The Village of Santee became incorporated on February 18, 1974, giving it the distinction of being both one of Nebraska’s oldest and newest towns.
Cultural and spiritual revival accompanied the expansion of the community on the Reservation. Despite a cultural renewal, tribal leaders believe three or four generations will be needed for full recovery of the old culture.
Aside from the Santee Normal Training School, the Reservation had none of its own educational facilities after the closing of the boarding school in 1909. The community wanted educational facilities that reflected their values and, in 1975, a school was built at Santee. The school was originally limited to kindergarten through eighth grade, and later offered a 4-year high school curriculum. A 2-year community college, one of the four branches of the Nebraska Indian Community College, is a fully accredited higher education institution that offers Associate of Arts, Associate of Science, and Associate of Applied Science degrees, and some certificate programs. The college offers a 2-year degree program in natural resources and provides contact information on natural resources internships, both paid and unpaid. The college has built a strong partnership with the Santee Sioux Land and Resource Management Offices by participating in several environmental projects.
Resource Setting
This chapter discusses the physical resource setting of the Reservation, including climate, drainage and landform, soils, land use, and geology and ground water.
Climate
The study area has a subhumid climate with warm summers and cold winters. July is the warmest month, with an average high temperature of 88.9 °F, and January is the coldest month, with an average low temperature of 9.0 °F. Extremes in temperature range from -31 to 109 °F. The annual mean temperature of the Reservation area is 48.3 °F (Nebraska Department of Natural Resources, 2003).
The mean annual precipitation for the 54-year period from 1948-2002 was 22.37 inches, as measured at the weather station at Niobrara. More than 60 percent of the rainfall occurs during the months of April to September, with occasional dry periods from the latter part of July through August.
The average annual potential evapotranspiration (PET) for the study area from 1964-97, as measured at the Dixon County site, was 40.18 inches. The site at Gavins Point Dam has a slightly longer record (1961-1995). There, the average was 46.93 inches. PET is the loss of water that would occur from the soil and through plants if the availability of water was not a limiting factor.
Drainage and Landform
Drainage in the study area consists of major rivers, creeks, and their tributaries. Howe, Hobu, Lost, and Sand Creeks flow into Bazile Creek, which flows into the Missouri River (figure 2-1). The Missouri River is deeply entrenched along the northern boundary of the study area and, as a consequence, most of the drainage is northward. Flood plains with low terraces have formed along Howe, Bazile, and Lost Creeks and the Missouri River. Elevations in the study area range from approximately 1200 feet above sea level, at the Missouri River, to 1900 feet in upland areas.
As described in the 1978 B&E Engineering, Inc., Phase I report (B&E Phase I report), Bazile Creek rises in Antelope County, enters the Reservation near the community of Center, and continues northward to its confluence with the Missouri River near the northwest corner of the Reservation. In all, it drains 365 square miles, 56.2 square miles of which lie on the Reservation. A tributary to Bazile Creek, Howe Creek drains the eastern and southeastern portions of the Reservation. Howe Creek drains approximately 93 square miles, 64.6 of which lie in the Reservation.
Figure 2-1. Reservation by drainage basins.
Lost Creek drains 26 square miles in the north-central to northwestern portion of the Reservation; the Lost Creek watershed lies entirely within the Reservation (Davis et al., 2001). The creek rises 2 to 3 miles south of the Village of Santee and flows southwesterly to its confluence with the Missouri River.
Except for the Missouri River, Bazile Creek has the largest average streamflow. Long-term streamflow data (1953-93) within the study area are available for one U.S. Geological Survey (USGS) continuous-record streamflow gaging station on Bazile Creek, near Niobrara (station number 06466500). This station was located 2.3 miles upstream from the confluence of Bazile Creek and the Missouri River, but it was discontinued in 1995. Flow characteristics are useful for forecasting seasonal low flows and for determining the adequacy of the streamflow for various supply requirements. Small minimum flows indicate that Bazile Creek is probably sustained during periods of little or no runoff by base flow. Further detailed discussion of depletions and natural flows of Reservation streams is presented in the B&E Phase I report.
The study area is located along the approximate boundary between the Dissected Till Plains section of the Central Lowland physiographic province and the nonglaciated Missouri Plateau section of the Great Plains physiographic province. In Nebraska, the Central Lowland merges almost imperceptibly into the Great Plains.
Lewis and Clark Lake (created by Gavins Point Dam, constructed in 1955) has inundated all the low-lying parts of the Missouri River Valley, except for high terraces near the Village and high terraces at the confluence with Bazile Creek. The major stream valleys in the study area include remnants along the Missouri River, areas along all of Bazile and Howe Creeks, and areas along the downstream reaches of Lost Creek. Bluffs and escarpments occur where the streams are deeply incised into the land surface and have formed on bedrock outcrops of chalk, shale, and siltstone. Bluffs and escarpments occur along Lewis and Clark Lake, Bazile Creek, and the downstream reaches of Lost and Howe Creeks.
Soils
Two major physical divisions occur within the Reservation: the Loess Hills in the southern portion and the Pierre Plains and Hills in the northern portion. Typically, the topography of the Loess Hills ranges from gently rolling to steeply rough and broken. Topography of the Pierre Plains and Hills is extremely rough and broken near the Missouri River, becoming more rolling as it approaches the Loess Hills.
The predominant parent materials for soils in the study area are alluvium and colluvium on the bottom lands and loess and Pierre Shale on the uplands. Soil associations occurring on bottom lands in the Missouri River Valley are subject to frequent flooding. Soil characteristics including texture, slope, and position are important factors affecting the hydrologic characteristics of the soil associations found in the study area.
Land Use
Land-use patterns (figure 2-2) can be related to landform and soils in the study area. The forests are primarily in the northern part of the study area and on bottom lands along Bazile, Lost, and Howe Creeks. Pasture and rangeland are primarily on the dissected plains with moderate to steep slopes. Cropland exists in the remainder of the study area, mainly in areas of rolling hills with slight to moderate slopes. The 2002 agricultural crop data for Knox County show corn as the largest harvested acreage, followed in decreasing order by hay, soybeans, and oats (Nebraska Agricultural Statistics Service). Livestock represent an important source of water demand and agricultural income in the area. The Tribe operates an 800-head cattle operation, as well as a 100-head buffalo operation. Figure 2-2. Land use data for the Santee Sioux Reservation.
Geology and Ground Water
The study area is underlain by approximately 1,600 to 1,800 feet of sedimentary Paleozoic, Mesozoic, and Cenozoic deposits which overlie relatively impermeable Precambrian basement rock (see table 2-1). The Paleozoic deposits, which formed in marine and near-marine environments, are generally composed of interbedded limestone, dolomite, dolomitic shales and limestone, and sandstone. These undifferentiated deposits evidently have not been used as a water source in the study area; therefore, their water quality and yield capabilities are not known. It is expected that any water yielded from these formations would contain high total dissolved solids (TDS). Estimated yields range from 50 to 200 gallons per minute (gpm). The great depth to these formations would more than likely preclude their future development as a significant source of water.
| Table 2-1. Generalized stratigraphic column for the Santee Indian Reservation, Nebraska | ||
| Era | System | Geologic unit |
| Cenozoic | Quaternary | Alluvial deposits |
| Eolian deposits | ||
| Glacial deposits | ||
| Tertiary | Ogallala Formation | |
| Mesozoic | Cretaceous | Pierre shale |
| Niobrara Formation | ||
| Carlile shale | ||
| Greenhorn limestone | ||
| Graneros shale | ||
| Dakota Formation | ||
| Paleozoic | Ordovician and Devonian, undifferentiated | Undifferentiated |
| Precambrian | Undifferentiated | Undifferentiated |
The Mesozoic era is represented by Cretaceous period formations. In descending geologic order, they include the Pierre Shale, Niobrara Formation, Carlile Shale, Greenhorn Limestone, Graneros Shale, and Dakota Formation. Of these, the Dakota Formation and the Codell sandstone member of the Carlile Shale are the only deposits known to yield significant potable water supplies. The Codell sandstone member is a thin (5 to 10 foot), confined layer of fine-grained sandstone located near the top of the Carlile Shale. It generally yields 10 to 30 gpm. The Dakota Formation is composed of interbedded sandstone and claystone. Depth to the top of the Dakota Formation generally ranges from 800 to 1,000 feet; its thickness varies from approximately 400 feet in the northwest portion of the study area to 600 feet in the southeast portion. It is a confined aquifer, although it may be hydraulically connected to the Lower Paleozoic system, where present. It has the potential to produce artesian wells in the study area. Well yields can range from 50 to 500 gpm.
The Pierre, Niobrara, most of the Carlile, and the Graneros Formations are composed of relatively impermeable materials. The Greenhorn Limestone may have some secondary permeability that could yield higher volumes of water, but it most likely would have high TDS.
The Tertiary Ogallala Formation, of the Cenozoic era, occurs mainly within the uplands of the study area where the formation has been subject to erosion. Composed of fluvial deposits of unconsolidated to semiconsolidated interbedded sand and silt, it is relatively thin, with a thickness ranging from about 10 to 50 feet. Although used extensively throughout the High Plains region, the Ogallala aquifer is not known to yield significant amounts of water within the study area. Well yields generally range from 10 to 50 gpm. Water from the formation is expected to be of intermediate to good quality.
Quaternary alluvial, eolian, and glacial deposits cap the entire study area, except where they have been removed by erosion along the margins of stream valleys. Glacial till is found in the upland areas and is composed of poorly sorted silt, clay, shale, and limestone fragments. The till has a low permeability, and wells yield less than 10 gpm. Eolian deposits are composed of silt and clayey-silt found in the upland areas. The eolian deposits are expected to yield less than 10 gpm.
The Quaternary alluvial aquifers supply most of the ground water in the study area. These aquifers are mainly composed of unconsolidated sand and gravel deposits with interbedded silt and clay. They are associated with recent major stream deposits and buried stream channels.
The alluvial aquifers in the lower reaches of the major tributaries overlie the Pierre and Niobrara Formations. The alluvial aquifer of the Missouri River adjacent to the Reservation overlies the Carlile Shale and Niobrara Formation (Reclamation, 1994). Well yields from these deposits can vary significantly (50 to 750 gpm), as can the water quality, depending on contributing inflow from adjacent formations or overlying streams. The alluvial aquifers are essentially unconfined, but buried stream channels may be confined to semiconfined.
The generalized local flow gradient in the Quaternary aquifers is towards the major stream channels that cut through these formations and act as drains. Discharge measurements made by USGS during November 1988 on all major streams in the study area (except the Missouri River) indicated that Howe and Lost Creeks are gaining streams (show increased streamflow) and Bazile Creek is mostly a gaining stream.
Community Services and Infrastructure
This chapter discusses aspects of public health and welfare, housing, and education as they exist on the Reservation.
Public Health and Welfare
An outpatient clinic serves the area. The clinic has two examination rooms and laboratory and X-ray facilities. There are four physicians who work half days at the clinic on a rotating basis. A physician’s assistant and five nurses (one full-time) staff the clinic. Dental services are also available 4-1/2 days per week, and a pharmacy is located in the clinic. A community tribal center; a K-12 school; a head-start program; a day-care program; and a community college (including a public library) are located in the area. The school had a total of 133 students during the 2002-03 school year; 57 of them were high school students.
The Village of Santee and Highway 12 and Howe Creek subdivisions are served by community water systems. The Village and Howe Creek subdivision have community sewer and wastewater treatment and disposal systems. The Santee-Sioux Utility Commission is responsible for operating the water, sewer, and solid waste facilities for these communities. Water quality, water supply systems, and wastewater disposal facilities are described later in the report.
The Indian Health Service (IHS) publication, Regional Differences in Indian Health (2000-2001), indicates that the Aberdeen service area (which includes the Santee Sioux Nation) had an overall death rate that was more than double the rate for all of the United States during the 1996-98 period. Heart disease accounted for 21.1 percent of all deaths in the Aberdeen service area, cancer accounted for 15 percent of all deaths, intentional injuries accounted for 14.4 percent of all deaths, and diabetes accounted for 7.5 percent of all deaths.
Housing
Currently, there are 143 tribal housing units in the Village. There are 30 units in rural areas scattered throughout the Reservation. Ten housing units are currently under construction near the Village of Santee, and infrastructure are available for 30 more. A 2001 housing study indicated a need for 27 more housing units by 2006. Housing priorities and the housing charges imposed are based on wages or self-help programs. Table 3-1 shows current housing statistics (based on the 2000 census).
The average household size estimates presented in table 3-1 for the Santee Reservation and for the Village are likely to be underestimated, especially for Native American households. Housing authorities have indicated that the average number of people in each household on the Santee Reservation is likely to be 4.5 to 5 persons per household. Regardless of the data source, Native American households are, on average, larger than the average for the rest of Knox County and the rest of Nebraska. At the same time, the vacancy rate of housing units in Santee and in the Santee Reservation is somewhat lower than for all of Knox County. The housing data do not indicate how many of those unoccupied housing units are unsuitable for occupancy.
Table 3-1. Housing
| Table 3-1. Housing | ||||
| Housing characteristic | Santee Village | Santee Reservation | Knox County | Nebraska |
Units Occupied units Vacancy rate Average household size All households Native American households |
115 93 19.1% 3.08 3.20 |
364 294 19.3% 2.98 3.20 |
4,773 3,811 20.2% 2.40 3.12 |
722,668 666,184 7.8% 2.49 3.32 |
Median rent Monthly ownership costs With a mortgage Without a mortgage |
$165 NA NA |
$179 $372 $190 |
$264 $607 $242 |
$491 $895 $283 |
Source: U.S. Bureau of the Census, 2000 census
Education
The level of educational attainment is somewhat lower on the Reservation than for the rest of Nebraska and the United States (table 3-2). Approximately 68 percent of the people 25 years of age or older living on the Reservation are high school graduates or the equivalent, compared to 75.2 percent for the United States as a whole and 81.8 percent for the State of Nebraska. There is a need to convert the existing 2-year community college to a 4-year program. A stronger economy would help to retain better educated people on the Reservation.
Table 3-2 Education levels
| Table 3-2 Education levels | |||||
| Level of education | Santee Village (%) |
Santee Reservation (%) |
Knox County (%) |
Nebraska (%) |
United States (%) |
Entire population High school (or equivalent) or higher Bachelors degree or higher |
73.5 8.1 |
81.1 9.6 |
82.0 14.4 |
86.6 23.7 |
80.4 24.4 |
Native American population High school (or equivalent) or higher Bachelors degree or higher |
72.4 1.6 |
75.2 3.9 |
74.6 5.1 |
75.9 8.8 |
70.9 11.5 |
Source: U.S. Bureau of the Census, 2000 census.
The education level of residents on the Santee Reservation and the Village of Santee is comparable when looking at high school graduation rates. However, the education level is considerably lower on the Reservation than in other areas when comparing the percentage of the population with a Bachelors degree or higher.
The relatively low percentage of the population with a Bachelors degree is a possible indicator that there is a need for a 4-year college program in addition to the current 2-year degree program. The need to maintain or improve the current level of educational attainment is very important in creating a strong Reservation economy.
Current Economic Conditions
This chapter discusses economic conditions on the Reservation, including unemployment, income, and poverty data. It also discusses commercial and industrial activity in the area.
Current economic conditions on the Reservation and in the area can be illustrated by looking at the types of employment available, unemployment rates, income, and the types of businesses and industry in the region. Most jobs held by Reservation residents are relatively low-paying jobs in the agricultural, services, and administrative support sectors. About 30 percent of employed persons work in agricultural jobs, 22 percent in service-related jobs, and 11 percent in administrative support jobs (U.S. Department of Commerce, 1997). Only 16 percent of the jobs are executive or professional specialty occupations, and 12 percent are higher-paying skilled labor jobs.
Unemployment, Income, and Poverty
Employment and income estimates are available from the 2000 census for Indian Reservations and other smaller areas. These data are presented to give some indication of the historical economic conditions on the Reservation. Unemployment, income, and poverty rates from the 2000 census are shown in table 4-1. Unemployment and poverty rates have been significantly higher on the Reservation than in Knox County and Nebraska as a whole, and income is significantly lower. The median annual household income on the Reservation was $20,938 in 1999, compared to $39,250 for Nebraska and $41,994 for the United States. The median annual household income for Indian households on the Reservation was $16,600. Per capita annual income was $9,532 on the Reservation, compared to $19,613 for all of Nebraska and $21,587 for the United States. Unemployment, as reported in the 2000 census, was 7.6 percent on the Reservation, compared to 3.5 percent for Nebraska and 5.8 percent for the United States in 1990. It should be noted that the procedures used to estimate unemployment as a percentage of the labor force can result in an underestimate of true unemployment in areas with chronic unemployment. Therefore, the estimated unemployment presented in table 4-1 on the Santee Reservation is likely to be lower than the actual unemployment rate.
| Table 4-1. Unemployment, income, and poverty rates | ||||
| Economic indicator | Santee Village | Santee Reservation | Knox County | Nebraska |
Unemployment Median household income Population at or below poverty |
20.0% $16,250 45.4% |
7.6% $20,938 33.1% |
3.7% $27,564 15.6% |
3.5% $39,250 9.7% |
Source: U.S. Bureau of the Census, 2000 census
Current Commercial and Industrial Activity
There are currently several businesses located on the Reservation. A 16-acre tribal industrial park is located 9 miles south of the Village of Santee on Highway 12. The Santee Nation operates a ranch that produces beef cattle and alfalfa. The ranch currently has over 800 head of cattle on approximately 3,400 acres of tribal land. A herd of 100 buffalo is maintained by the Santee Nation in an effort to promote cultural ties and tourism. The Santee Nation also owns and operates the Lewis and Clark grocery store, which is planned for expansion. Other businesses on the Reservation include the Ohiya Casino; the Santee Pony Express gas station, which employs about 11 people; Isanti Contractors; and the Takoja Tipi Day Care Center. The Casino opened in early 1996 and provides about 15 jobs. The largest employers in the study area are the Santee Sioux Tribe, which employs 73 people, and the Santee Public School, which employs 50 people (Nebraska Department of Economic Development, 2003).
Tourism, centered around Lewis and Clark Lake, has not generated as much revenue for the Santee Nation as might be expected. Hunting, fishing, and other sports have been developed mainly by private interests in the nearby Devil’s Nest Area. Other recreational facilities in the area include a public golf course, tennis courts, a public swimming pool, and two public parks.
Crop and livestock production are important parts of the Knox County and Reservation economy. Corn is the dominant irrigated and dry land crop, and cattle represent a large percentage of total agricultural sales. Approximately 83 percent of the total value of agricultural products sold in Knox County was related to cattle. Hay, oats, and soybeans are also important crops. The Census of Agriculture acreages are presented in table 4-2.
Table 4-2. Knox County cropping patterns
| Crop/Land | 1985 | 1989 | 1993 | 1997 | 2001 |
Irrigated land Corn Soybeans Hay |
23,000 1,300 3,500 |
31,700 3,600 7,900 |
27,800 5,800 4,600 |
28,100 11,500 2,400 |
31,100 16,800 4,500 |
All land Corn Sorghum Oats Soybeans Hay |
114,900 8,500 58,000 22,000 91,000 |
100,500 5,300 41,000 34,000 84,000 |
107,000 5,000 42,000 37,000 99,000 |
111,800 500 6,900 54,400 86,000 |
110,000 - 7,400 68,000 93,000 |
Source: U.S. Department of Agriculture, Census of Agriculture, 1997
The number of farms in Knox County decreased from 1,212 farms in 1987 to 1,053 in 1997, a reduction of about 13 percent. However, the size of the average farm has increased by 10 percent, from 507 acres to 566 acres. About 75 percent of all the agricultural enterprises in Knox County included cattle. Total livestock sales in Knox County were $136.5 million in 1997, and total crop sales were $28.2 million. The net cash return for agricultural operations averaged $26.90 per acre in 1997. Production expenses averaged about $140,100 per farm in 1997.
The 1981 B&E Engineering, Inc., Phase II report (B&E Phase II report) included estimates and projections for irrigated acreage and livestock production on the Reservation. The report estimated a total of 1,036 irrigated acres on the Reservation in 1980. Irrigated acres on the Reservation were projected to increase to 5,690 in 2000. The Census of Agriculture for 1978 and 1997 shows that the number of irrigated acres in Knox County increased by about 37 percent over the 1978-97 period. Although the number of irrigated acres on the Reservation may have increased over the last 20 years, the Reservation accounts for a relatively small percentage of total irrigated acreage in Knox County. Livestock production is the most important agricultural activity on the Reservation.
Future Economic Growth
The future growth of business and industry on the Santee Reservation cannot be predicted with certainty because of the large number of external factors that could potentially affect economic development. Unlike population projections, future commercial and industrial growth may not be influenced greatly by current business patterns. Businesses may locate in a region or leave an area for a variety of reasons that are unrelated to past business location decisions. These reasons may include the availability of tax incentives, transportation linkages, infrastructure, and a labor force.
Potential Areas of Economic Growth and Possible Location of Growth
A strip mall in the Village is planned for the near future. The strip mall includes nine lots. Several different types of businesses would locate in the strip mall, including a convenience store, a bar, a used clothing store, and a laundromat. Other businesses likely to locate in the strip mall would be similar, service-oriented businesses. Additional potential future development includes a gas station, near Highway 12, and a recreational vehicle (RV) park. Planned future community buildings and facilities include a police and fire station in the Village, a boy’s and girl’s club, a fitness center, a community center and park, and a swimming pool.
Future industrial development on the Reservation would most likely be in the industrial park on Highway 12 or in a new industrial site planned for the south of town. Industries that have been considered or attempted in the area but have not been successful or completed include a medical supply facility, a box factory, a meat packing plant, and a hog operation. Any future industrial development is likely to be of a small scale and could include activities such as processing food, assembling components, or some other type of light industry.
Agricultural development has been an important part of the Santee Reservation economy in the past and will continue to be important in the future. The B&E Phase II report (1981) indicated that about 12 percent of the total number of cattle, hogs, sheep, and chickens in the region were on the Reservation. This represents a significant percentage of the total livestock in the county and indicates that livestock are a very important part of the Reservation and county economy. The Santee Nation has aggressively pursued agricultural development aggressively through the acquisition of neighboring ranching and farming land. Growth in ranching would be expected in the future. The number of cattle may increase, perhaps to as many as 1,000 head. The buffalo herd will also likely increase in the future, perhaps to 200 head. Logging and reseeding operations represent another potential source of future development.
Housing and educational programs in the past have been responsible for 121 single family dwellings, 4 duplexes, a housing project for the elderly, and a school that was built in 1975 and now houses a kindergarten and grades 1 through 12. Residential development will continue into the future, and 30 home sites will become available behind the planned strip mall. Residential development will be needed to support the projected increase in population. This population increase and residential development will result in an increase in service and goods oriented businesses, such as those likely to locate in the strip mall.
Lime, gravel, and sand resources in the area may present potential opportunities for future mining activities. Recreational development associated with Lewis and Clark Lake may offer opportunities for economic growth in the service sector. The Tribe has indicated an interest in building a golf course and park facilities. The Ohiya Casino represents a significant source of employment to the Reservation (the class II gaming facility is in full operation). Gaming could be an increasing source of future employment and income. The Tribe has indicated a desire to expand the casino at some point in the future. Other desired development associated with the casino includes a hotel and, possibly, a golf course.
The high level of unemployment indicates that there is a readily available workforce as a percentage of the total population. However, the relatively low level of education, limited work experience, and the small labor pool in absolute terms limits the types and size of establishments that could move onto the Reservation.
The recent completion of the Chief Standing Bear Memorial Bridge has greatly improved access to the Santee Reservation from several South Dakota towns. The bridge connects South Dakota Highway 37 and Nebraska Highway 14 and is about 2 miles from the village of Niobrara. It is unclear whether the bridge will ultimately benefit the South Dakota towns or the Nebraska towns the most. However, the bridge does provide the Santee Reservation with the potential to improve its prospects for economic development compared to conditions without the bridge.
The size of these new establishments cannot be predicted with any certainty because the demand for future goods and services is unknown. For the purposes of this analysis, the following assumptions were used. The casino was projected to double in size, and a 50-space RV park was projected, along with a 100-room hotel. The new light-industry establishment was assumed to have about 35 employees, and a 9-hole golf course was assumed. Finally, the community center would include a 2-acre park and a 10,000-square-foot swimming pool.
Summary of Future Commercial Growth
Future commercial growth on the Santee Indian Reservation will most likely be limited to service-oriented establishments, specialty stores, and, perhaps, small industrial establishments.
Based on the information available, the following future development is projected:
- A strip mall: nine lots; all service oriented
- One additional small, light-industrial establishment, either at the planned new site or the existing site
- A gas station/convenience store
- An RV park
- Casino expansion
- A hotel near the casino
- Community buildings and facilities, including a police station, a fire station, a boys’ and girls’ club, a fitness center, a community center and park, and a swimming pool
- Continued growth of the tribal ranching operation and buffalo herd
- Possibly, a golf course
Santee Indian Reservoir Base Population and Population Projections
Base Population
This chapter discusses Santee Indian Reservation population projections and presents information on census data, birth rates, mortality rates, and migration.
The future population of the Santee Reservation depends, in large part, on the level and characteristics of the current population, as well as migration patterns. The 2000 census estimated the population of the Santee Reservation at 878 people. A common criticism of census estimates is that they undercount the true population, especially in rural areas and on Indian Reservations. Undercounting on Indian Reservations is particularly problematic because some households may not be willing to disclose the number of people living in a home out of fear that assistance from various programs may be threatened. As a result, it is possible that the population of the Santee Reservation was underestimated in the 2000 census because the true number of people living in individual households is underestimated.
According to Bureau of the Census estimates, the 1990 census underestimated the number of American Indians in Nebraska by 4.9 percent and the white population by 0.4 percent. The Bureau of the Census made an effort to reduce the population undercount for the 2000 census to improve the accuracy of the population estimates. Statistics are not yet available to determine the undercount for various races in various parts of the country for the 2000 census. However, the U.S. Census Monitoring Board has indicated that some undercounting occurred in the 2000 census. The estimated average household size on the Reservation (from the 2000 census) was 2.9 people.
The Santee Tribe has estimated that about 750 of the nearly 2,800 tribal members reside on the Reservation. By contrast, the 2000 census estimated a total of 563 American Indians lived on the Santee Reservation. If it is assumed that the 2000 census underestimated the number of people per household but was accurate in estimating the total number of households, this would result in an estimated 3.9 people per household. This is a number that better correlates with the number that would be expected by the tribal housing authority. Therefore, for the purposes of this analysis, the 2000 base population of the Reservation was estimated to be 1,065 people.
Population Projections
Population projections can be completed using trend analysis or demographic modeling. Trend analysis is based on historical changes in population and the assumption that past age, birth rate, fertility, mortality, and migration trends will continue into the future. Trend estimates can be modified qualitatively to account for changes in variables that may be expected in the future.
Demographic modeling involves the estimation of relationships between demographic characteristics and population levels that can be used to project future population. These characteristics include mortality, birth rates, and net migration. The demographic modeling technique is used to project the future population of the Santee Indian Reservation in this analysis.
The methodology and assumptions used to project the future population are described below. The population projections for the Santee Reservation were generated using the cohort component method. A cohort represents a group of individuals who have a specific factor (such as age) in common. For example, all males age 19 to 25 represent a cohort. The cohort component method involves separating the population under consideration into cohorts, looking at the demographic components of each cohort, and projecting the population of each cohort for successive time periods into the future.
The first step in implementing the cohort component method is to apply specific age-sex survival rates to each group and carry that population forward to the next age group. Next, the net number of migrants is added to the population carried forward in the first step to derive the projected population. Projecting the population of the less than 1-year-old age group is complicated by the fact that this future group does not currently exist. As a result, the future 0 to 1-year-old age cohort is projected by applying the age-specific birth rates to the 15- to 44-year- old female population of childbearing age. The projected births are then multiplied by the appropriate survival and net migration rates.
The components of a demographic modeling analysis include birth rates and mortality.
Birth Rates
Birth rates are used in demographic models to project births within specific age groups. The birth rate for an age group, combined with the population of females within that age group, can be used to estimate births. Birth rates for the female population of child-bearing age are available by age group and race from the Department of Health and Human Services.
Birth rates are also available by State. Projections of future birth rate are available by race and age group for the United States from the U.S. Bureau of the Census. The projections of future birth rates can be combined with current birth rates to project future birth rates in the study area. The birth rates used to project future population on the Reservation are presented in tables 5-1 and 5-2. Birth rates specific to the Native American and non-Native American populations were used to improve the accuracy of the estimates.
Table 5-1. Native American birth rates used to project population
| Table 5-1. Native American birth rates used to project population | |||||||||||
| Age | 2000 | 2005 | 2010 | 2015 | 2020 | 2025 | 2030 | 2035 | 2040 | 2045 | 2050 |
| (years) | (births per 1,000 women) | ||||||||||
| 10-14 | 1.6 | 1.6 | 1.6 | 1.6 | 1.6 | 1.6 | 1.5 | 1.5 | 1.6 | 1.6 | 1.6 |
| 15-17 | 48.3 | 48.0 | 48.6 | 48.6 | 48.3 | 47.6 | 47.3 | 47.3 | 47.6 | 47.6 | 47.6 |
| 18-19 | 138.0 | 137.0 | 138.9 | 138.9 | 138.0 | 136.0 | 135.1 | 135.1 | 136.0 | 136.0 | 136.0 |
| 20-24 | 165.4 | 164.3 | 166.6 | 166.6 | 165.4 | 163.1 | 162.0 | 161.9 | 163.1 | 163.1 | 163.1 |
| 25-29 | 130.4 | 129.5 | 131.3 | 131.3 | 130.4 | 128.6 | 127.7 | 127.7 | 128.6 | 128.6 | 128.6 |
| 30-34 | 83.3 | 82.7 | 83.9 | 83.9 | 83.3 | 82.2 | 81.6 | 81.6 | 82.1 | 82.1 | 82.1 |
| 35-39 | 39.6 | 39.4 | 39.9 | 39.9 | 39.6 | 39.1 | 38.8 | 38.8 | 39.1 | 39.9 | 39.1 |
| 40-44 | 8.9 | 8.8 | 9.0 | 9.0 | 8.9 | 8.8 | 8.7 | 8.7 | 8.8 | 8.8 | 8.8 |
| 45-49 | 0.5 | 0.5 | 0.5 | 0.5 | 0.5 | 0.5 | 0.5 | 0.5 | 0.5 | 0.5 | 0.5 |
Source: U.S. Department of Health and Human Services, 2002.
Table 5-2. Non-Native American birth rates used to project population
| Table 5-2. Non-Native American birth rates used to project population | |||||||||||
| Age | 2000 | 2005 | 2010 | 2015 | 2020 | 2025 | 2030 | 2035 | 2040 | 2045 | 2050 |
| (years) | (births per 1,000 women) | ||||||||||
| 10-14 | 0.8 | 0.9 | 0.9 | 1.0 | 1.0 | 1.1 | 1.1 | 1.2 | 1.2 | 1.2 | 1.3 |
| 15-17 | 52.2 | 53 | 56 | 56.6 | 57.8 | 58.7 | 60 | 61.3 | 62.7 | 64 | 65.1 |
| 18-19 | 52.2 | 53 | 56 | 56.6 | 57.8 | 58.7 | 60 | 61.3 | 62.7 | 64 | 65.1 |
| 20-24 | 109.8 | 111.1 | 112.6 | 115.6 | 116.7 | 118.7 | 120.3 | 122 | 123.6 | 125.4 | 127.3 |
| 25-29 | 119.4 | 120.3 | 120.7 | 121.4 | 122.5 | 123.1 | 124 | 124.8 | 125.5 | 126.2 | 127 |
| 30-34 | 80.6 | 80.3 | 82 | 81.8 | 82.2 | 82.3 | 82.6 | 83.2 | 83.7 | 84 | 84.3 |
| 35-39 | 31.4 | 31.8 | 31.7 | 32.9 | 32.8 | 33.1 | 33.2 | 33.5 | 33.9 | 34.3 | 34.5 |
| 40-44 | 5.4 | 5.4 | 5.6 | 5.6 | 6 | 5.9 | 6 | 6.1 | 6.2 | 6.4 | 6.5 |
| 45-49 | 0.2 | 0.2 | 0.2 | 0.2 | 0.2 | 0.3 | 0.3 | 0.3 | 0.3 | 0.3 | 0.3 |
Source: U.S. Department of Health and Human Services, 2002.
Mortality
Mortality rates are applied to specific age-sex groups to estimate survival for each group. Mortality rates indicate the percentage of a specific age-sex group that would be expected to die.
The current mortality rates used in this analysis were obtained from the Department of Health and Human Services, Center for Disease Control and Prevention and from the U.S. Department of Health and Human Services, Indian Health Service.
Current mortality rates used in the analysis are presented in table 5-3. The Bureau of the Census has historical death rates by age, sex, and race for the U.S. population and projects life expectancy at birth and at age 65 through the year 2050 for the U.S. population. The Bureau of the Census projections were used to adjust future mortality rates and are shown in table 5-3.
Table 5-3. Current mortality rates used in the demographic model, deaths per 100,000 population
| Age group | Native American male |
Native American female |
Non-Native American male |
Non-Native American female |
Projected annual rate of change in mortality rates (%) |
Under 1 year 1 to 4 years 5 to 14 years 15 to 24 years 25 to 34 years 35 to 44 years 45 to 54 years 55 to 64 years 65 to 74 years 75 to 84 years 85+ years |
1,300.5 87.3 38.1 247.1 319.4 555.0 985.1 2,016.3 4,039.1 6,688.6 10,989.5 |
908.9 78.1 34.0 100.5 150.6 338.3 543.5 1,359.9 3,051.6 5,347.0 8,922.1 |
637.0 31.9 20.4 100.7 127.6 231.6 501.7 1,188.6 2,993.3 6,924.1 17,294.4 |
513.4 24 14 42.2 57.8 127.7 286.3 750.4 1,931.1 4,936.4 15,225.8 |
-2.96 -3.03 -2.44 -1.72 -1.02 -0.71 -1.60 -1.34 -0.82 -0.61 +0.14 |
Source: U.S. Department of Health and Human Services, n.d.
Migration
Generally, changes in birth and mortality rates are slow and somewhat predictable. However, outside influences can cause rapid and significant changes in migration rates with little warning. Therefore, migration is the most difficult demographic component to project with confidence. In addition, there is a general lack of time-series data that report accurate migration patterns by age and sex at a detailed level of analysis. A range of migration assumptions is used to project the future population of the Santee Reservation under three scenarios. Each scenario has the same assumption that net migration of the non-Indian population is zero. The non-Indian portion of the Reservation population has actually decreased over the last 30 years, with the largest portion of the decrease occurring from 1980 to 1990. However, the non-Indian population of the Santee Reservation remained fairly stable from 1990 to 2000, decreasing from 333 to 315 people. The recent stabilization of the non-Indian population was used as a basis for assuming zero net migration of the non-Indian population on the Reservation.
The migration assumptions for the Indian population vary between scenarios, ranging from zero net migration to a 1-percent annual net migration increase. Population projections based on the information and assumptions presented above are shown in table 5-4.
Table 5-4. Population projections for the Santee Reservation
| Table 5-4. Population projections for the Santee Reservation | |||
| Year | Assuming zero net migration | Assuming Indian net migration of 0.5% | Assuming Indian net migration of 1.0% |
2000 2005 2010 2015 2020 2025 2030 2035 2040 2045 2050 |
1,065 1,025 1,105 1,180 1,260 1,345 1,425 1,500 1,570 1,640 1,715 |
1,065 1,040 1,145 1,240 1,350 1,460 1,575 1,685 1,795 1,905 2,025 |
1,065 1,060 1,190 1,320 1,470 1,640 1,815 2,005 2,200 2,410 2,645 |
As of April 2001, the Santee Sioux Nation of Nebraska had 2,750 tribal members. The Santee Health Clinic, IHS determined that there were approximately 1,460 tribal members on or near the Santee Reservation as of April 2001. The estimated American Indian population on the Santee Reservation by the year 2050 is 2,370 people. The information on the total number of tribal members, and tribal members on or near the Reservation, indicates the 1.0-percent migration assumption can be supported, assuming adequate housing is available. Therefore, the 1.0-percent migration scenario is considered the best projection.
In 1991, a separate population projection analysis was completed for the Santee Sioux Nation by Gilat Planning and Research, Inc. These projections assumed zero net migration and resulted in a projected 899 people on the Reservation in 2005 and 943 people in 2010. The projections presented in table 5-4 show a larger population than estimated in the Gilat analysis. However, the adjusted base population used in this analysis is much higher than the 2000 census based population used in the Gilat analysis. The growth percentage used in this analysis is very similar to the percentage used in the Gilat analysis.
It should be noted that errors in the assumptions will be magnified as the projections move further into the future. As a result, the population projections are likely to become less accurate further into the future.
Water Quality
This chapter briefly reviews water quality regulatory criteria and summarizes overall water quality conditions on the Reservation as contained in published and unpublished documents.
Preface
Reauthorized in 1986, the Safe Drinking Water Act (SDWA) was authorized by the United States Congress to guide and regulate the quality of water supplied for drinking purposes. This legislation sets enforceable primary standards (Maximum Contaminant Levels [MCLs]) for constituents that impose health risks and recommends nonenforceable secondary standards (Secondary Maximum Contaminant Levels [SMCLs]) for constituents that pose no direct health risk but may impart undesirable aesthetic properties to potable water.
Most water quality problems on the Reservation are attributable to elevated levels of SMCL constituents (e.g., iron, sulfate, manganese, and TDS). Although not considered to pose a direct health risk, poor water quality resulting from these constituents can have detrimental economic impacts. This is a pervasive, Reservationwide problem.
To lend understanding to the water quality information presented in this section (and later in the report), capsule descriptions of the most common problems associated with SMCL constituents characteristic of Reservation water supplies are given below:
Total Dissolved Solids (TDS) - TDS refers to the presence of dissolved mineral species (e.g., sodium, chloride, sulfate and calcium, etc.) in water. Some of these constituents may cause taste and odor problems, damage plumbing, or cause scaling in hot water heaters. A maximum level of 500 milligrams per liter (mg/L) is recommended by the U.S. Environmental Protection Agency (U.S. EPA) for drinking water supplies. A TDS greater than 500 mg/L is not recommended for agricultural utilization.
Sulfates - Water containing sulfate concentrations greater than 250 mg/L may have a cathartic effect. The U.S. EPA 1991 Drinking Water and Health Advisories Document (U.S. EPA, 1991) indicates a proposed primary MCL for sulfates of 500 mg/L.
Chlorides - Chloride concentrations greater than 250 mg/L usually produce a noticeable taste in drinking water.
Iron - Clothing washed in water containing excessive iron may become stained a brownish color. Iron also affects the taste of beverages such as tea and coffee.
Manganese - Manganese produces a brownish color in laundered clothing, can leave a black stain on fixtures, and affects the taste of beverages.
Findings
As mentioned in the introductory section of this report, several comprehensive reports have been prepared that address the water resources of the Reservation. These include the B&E Phase I and II reports (1978, 1981), the USGS administrative report (1995), and three reports prepared as part of ongoing tribal environment programs (Davis et al. 2000: Davis et al. 2001; and Davis et al. 2003). Findings from the U.S. EPA Title 106 Water Quality Management Program on the Reservation, show evidence of MCL exceedance for nitrate-nitrogen and total coliform bacteria in potable water within the Reservation. Most Reservation wells tap shallow alluvial aquifers hydraulically connected to surface water. Without proper chlorination and provision of required chlorine contact time, the potential for bacterial contamination of the water derived from these wells is always present. Summary findings from the B&E and USGS reports and the U.S. EPA Title 106 program are presented below.
B&E Phase I Report
The B&E Phase I report (1978) offers a compilation of surface and ground-water quality for the Reservation through the date of issue. Data were obtained from records of the USGS, Nebraska Department of Environmental Control, and the Indian Health Service. As documented in the report, ground water was shown to have the most quality constraints. Problems identified include:
- High natural fluoride concentrations in some areas
- Some high nitrate and chloride concentrations
- Very high iron and manganese concentrations in conjunction with very high sulfate
- High total dissolved solids
While surface waters were generally of better quality it is noted that a significant pulse of pesticides enters these waters via nonpoint source pollution during the spring and early-summer each year. This is especially common in Bazile Creek and Howe Creek and to a lesser degree in the Missouri River.
It is concluded in the report that, “Ground water ...does not nearly approximate the quality of the surface water sources. Poor quality, coupled with the poor obtainability of large quantities of ground water, do not leave it as a highly exploitable natural resource.” It is further indicated that the Missouri River constitutes the best source of water for the Reservation.
USGS Administrative Report
More recently, ground-water quality information for the Reservation was compiled in the 1995 USGS administrative report. Existing data are presented for three wells tapping the Dakota Formation, along with new data obtained in 1990 from five wells completed in the Quaternary alluvial aquifer on the Reservation and one in the near vicinity. Surface water quality is reported for five samples collected in 1990, along with specific conductance measured in 1988 from water samples from 16 low-flow measurement sites along Howe, Lost, and Bazile creeks on the Reservation.
Ground-water samples were analyzed for major ions, trace elements, and nutrients. Three of the six samples were analyzed for Triazine herbicides. Surface water samples were analyzed for major ions, trace elements, nutrients, and bacteria.
Sample site locations and analytical results are detailed in the 1995 USGS report, which should be consulted for additional information. Summary results from that report are discussed below.
Ground Water
- Specific conductance was relatively low in samples from the Quaternary alluvial aquifer and relatively high in samples from the Dakota aquifer.
- pH values ranged from 7.1 to 7.7 for all wells.
- Dissolved oxygen concentrations ranged from 1.0 mg/L to 10.4 mg/L in the Quaternary alluvial aquifer.
- The SMCL for sulfate (250 mg/L) in drinking water was exceeded in one well in the Quaternary alluvial aquifer and in all wells in the Dakota aquifer.
- The SMCL for dissolved solids (500 mg/L) was exceeded in one well in the Quaternary aquifer and one well in the Dakota aquifer.
- Major cation/anion concentrations generally were higher, but alkalinity and silica concentrations were lower in water from the Dakota aquifer than in water from the Quaternary alluvial aquifers.
- The 50 micrograms per liter (µg/L) MCL for arsenic and selenium was not exceeded in any of the wells.
- Manganese concentrations ranged from 3 to 2,800 µg/L in the wells in the Quaternary alluvial aquifer, and they measured 170 and 180 µg/L in two of the wells in the Dakota aquifer (SMCL of 50 µg/L).
- The MCL for nitrate-nitrogen of 10 mg/L was not exceeded in any of the wells. It is concluded in the report that ground water from the Quaternary alluvial aquifers in the study area is generally more acceptable for potable use, irrigation, and industrial uses than water from the Dakota aquifer. Water from the Dakota aquifer has limited use because of greater overall depth and water-quality constraints posed by high hardness, TDS, and sulfate concentrations.
Surface Water
- Specific conductance ranged from 256 microsiemens per centimeter (µs/cm) along the upstream reach of Howe Creek to 1,484 µs/cm near the confluence of Lost Creek with Bazile Creek.
- The presence of fecal coliform bacteria and fecal streptococci colonies in samples collected from Lost Creek indicates that water from the creek should not be used for drinking purposes without treatment.
The following information pertains to the five surface water samples collected in 1990:
- Surface water hardness varied from 250 to 760 mg/L as CaCO3, and calculated dissolved solids ranged from 329 to 1,010 mg/L.
- The MCL for fluoride (4.0 mg/L) and the SMCL for chloride (250 mg/L) and fluoride (2.0 mg/L) were not exceeded.
- The SMCLs for sulfate (250 mg/L) and TDS (500 mg/L) in drinking water were equaled or exceeded in water from one sampling site.
- Arsenic concentrations ranged from 1 to 5 µg/L, and selenium concentrations ranged from 6 to 11 µg/L. All results were less than the 50 µg/L MCL for arsenic and selenium. Arsenic concentrations in ground water and surface water will have to be re-evaluated in the feasibility study with respect to the newly promulgate MCL of 10 µg/L.
- Boron, iron (SMCL of 0.3 mg/L), manganese (SMCL of 0.05 mg/L), and zinc (SMCL of 5 mg/L) concentrations varied from 50 to 170 µg/L, less than 3 to 24 µg/L, 14 to 290 µg/L, and less than 3 to 12 µg/L, respectively.
- Dissolved nitrate-plus-nitrite concentrations were less than 3.0 mg/L as nitrogen.
- Dissolved phosphorus concentrations were less than 0.05 mg/L.
U.S. EPA Title 106 Tribal Water Quality Management Program
The Santee Tribe conducted a U.S. EPA Title 106 Water Quality Management study on the Reservation. Since 1996, the program objectives (in part) have been to establish prevailing Reservationwide water quality levels for a range of organic and inorganic constituents, based on samples collected from multiple ground water and surface water sites. This project involved collection and analysis of water samples from five surface water sites within the Reservation (Table 6-1) and 52 domestic wells/springs. Surface water samples were collected approximately weekly from early-May through early-August 1996, quarterly in 1997 through 2001, and daily for a brief period in the spring of 1998. Thirty-nine wells were sampled one time in mid-summer 1996 and an additional 13 wells were sampled in 1998. Ten wells were selected from this initial set as quarterly monitoring sites and have been sampled quarterly through 2001. The water samples were analyzed for major inorganic parameters, nitrate-N and selected pesticides (atrazine, alachlor, acetachlor, cyanazine, metolachlor, and two daughter products DEA and DIA).
Table 6-1. Site location
| Table 6-1. Site location | |
| 1 – Bazile Creek South | Bazile Creek near Center, Nebraska, just above the confluence with Howe Creek |
| 2 – Howe Creek | Howe Creek, about 2 miles above the confluence with Bazile Creek |
| 3 – Bazile Creek North | Bazile Creek at Highway 12 |
| 4 – Lost Creek | Lost Creek where it crosses Santee Spur |
| 5 – Missouri River | Just west of Santee, Nebraska |
Water in Bazile Creek, Howe Creek and the Missouri River tend to class as Ca-Mg-Na-HCO3 -SO4 type water. Water in Lost Creek classes as Ca-Mg-Na-SO4-HCO3 type water. Total dissolved solids generally exceed 500 mg/L for all streams except the Missouri River, which has a concentration just below the 500 mg/L TDS limit. Nitrate-N concentrations are highest in Bazile Creek and Howe Creek where they generally range from 3 to 6 mg/L. Nitrate-N concentrations in Lost Creek are <1 mg/L. The Missouri River typically has nitrate-N concentrations <1 mg/L also. The source of the nitrate-N in Bazile and Howe creeks is believed to be nonpoint source contamination related to agricultural fertilizer application. Sulfate concentrations in Bazile Creek, Howe Creek and the Missouri River range from 100 to 300 mg/L. Lost Creek has extremely high concentrations of sulfate, ranging from 600 to over 800 mg/L. The source of the sulfate in Lost Creek is dissolution of gypsum from the Pierre Shale Formation. All of the streams within the Reservation have total coliform bacteria >200 colony forming units per 100 milliliters throughout most of the year. The source of the bacteria is probably from confined feeding operations and livestock on pasture.
The pesticides atrazine, alachlor, acetachlor, metolachlor, cyanizine and the two daughter products DEA and DIA were detected in several Reservation streams. The greatest concentrations were detected in Bazile Creek, Howe Creek and the Missouri River. Atrazine concentrations in Bazile Creek ranged from < detection to 7.5 µg/L. The U.S. EPA primary drinking water standard for atrazine is 3 µg/L. Alachlor concentrations in Bazile Creek ranged from < detection to 0.37 µg/L. The U.S. EPA primary drinking water standard for alachlor is 2 µg/L. The Missouri River had the next highest concentrations of pesticides where atrazine ranged from < detection to 1.6 µg/L and alachlor ranged from < detection to 0.15 µg/L. Concentrations of atrazine and alachlor in Howe Creek were generally less than 0.5 µg/L. Pesticides were only detected in Lost Creek on a few occasions at just above the detection limit of 0.05 µg/L. The source of the pesticides for all Reservation streams is nonpoint contamination resulting from agricultural application for row crop production.
No pesticides were detected in the 39 domestic wells/springs which were sampled in July and August 1996. However, pesticides were detected in 7 wells sampled in 1998. Atrazine was detected in 6 samples and five samples contained metolachlor, four of these coincident with the atrazine detections. Samples from two wells had very small concentrations of DEA. Follow up samples during the next quarter showed no detections in these wells. No established MCL’s for pesticides were exceeded. The wells and springs derive water from a variety of aquifers including the Dakota Formation, alluvial deposits along Bazile Creek, Howe Creek and the Missouri River, and isolated pockets of glacial outwash. Twenty six percent of the wells sampled exceeded the U.S. EPA primary drinking water standard for nitrate-N (10 mg/L). Samples exceeding the limits ranged from just over 10 to as much as 137 mg/L. Approximately 44 percent of the ground-water samples exceeded the U.S. EPA primary drinking water standard for total coliform bacteria of 1 cfu/100 mL.
Approximately 43 percent of the ground-water samples with elevated nitrate-N also contained bacteria. These data suggest that the source of the nitrate-N and bacteria at these locations is probably related to septic system effluent or on-site confined animal feeding operations, rather than nonpoint source agricultural contamination. The absence of pesticides in these samples also supports this conclusion.
Water Resources Evaluation
This chapter addresses Reservationwide ground-water sources and briefly discusses the sedimentation of the Bazile Creek well field.
Bazile Creek Well Field
During project scoping meetings with Reclamation, the Tribe mentioned that the quality of the water in the municipal wells degrades during annual flooding events in the Bazile Creek basin. The Tribe attributed the problem to an augmented rate of sedimentation of Bazile Creek with a subsequent increase in elevation of the riverbed. They indicated that, in some locations, the riverbed rises high enough to cut a new channel, and the Tribe believes that the increase in sedimentation has resulted in an increase in water levels in the alluvial aquifer. According to the Tribe, there is a visual increase in the turbidity of the well water during flood events.
Anecdotal and observational evidence exist to support the sedimentation and rising water table in the lower reaches of Bazile Creek. No supporting evidence has been collected related to increased turbidity of well water associated with flood events. The bridge on the county road that runs south from Highway 12 to Center, Nebraska was recently replaced because increased elevation of the streambed resulted in less space between the bridge and the stream bed causing increased debris accumulation on the upstream side of the bridge. Another example was observed where Bazile Creek flows under the Highway 12 bridge. Here the channel has taken on the classic appearance of a distributary system as it builds delta into the backwater of Lewis and Clark Lake. The 1995 removal of the USGS stream gage located at this site resulted, in part, because of high maintenance caused by quickly changing channel morphology as a consequence of streambed aggradation. The present channel of Bazile Creek is contained by engineered levees and is elevated relative to the surrounding floodplain in the vicinity of the Bazile Creek well field. What once was productive farm land has now been converted to an excellent wetland as a result of frequent flooding and continuing water table rise beneath the property.
The aggradation of Bazile Creek has exacerbated the frequency and magnitude of flooding in the lower reaches of the creek. A record flood flow occurred in 1999 that inundated the well field. The wells, which at that time were only slightly above the floodplain, were flooded resulting in contamination of the public water supply by fecal coliform bacteria. Several months of cleanup were required to return the public water supply to full capacity. Emergency water was trucked in for an extended period during this crisis. Following this event, the wells were elevated above the floodplain to a height sufficient to avoid future inundation problems. Flooding in this section of Bazile Creek in subsequent years has pushed water across Highway 12 to near the base of the existing well field. The Bazile Creek channel is actively attempting to move to a lower elevation adjacent to Highway 12, and will likely make a new channel with the next significant flood event. This has implications concerning the long-term viability of the Bazile Creek well field in terms of both water quality and water quantity.
Davis et al. (2003) recently completed a ground-water model to evaluate potential yield from this alluvial aquifer and to quantify the degree of stream-aquifer interaction in the vicinity of the Bazile Creek well field. They concluded that a direct hydrologic connection exists between the aquifer and the well field, and that approximately 99 percent of the water produced by the well field comes from Bazile Creek via induced infiltration. From this it is concluded that sufficient quantity is available to meet the projected 400 gpm demand for the tribal water system as proposed in the 1997 assessment report. It is anticipated that production from the existing well field at a new projected peak day demand of approximately 970 gpm may create excessive drawdown and exceed the yield capability of this shallow alluvial aquifer. The ground-water model will have to be modified incorporating the new projected peak rate to fully assess the impact of this scenario. This will be completed as part of the overall needs assessment and future feasibility study for the Santee tribal water system. Water samples collected as part of this effort had no MCL exceedances. While nitrate-N is typically 3-6 mg/L in Bazile Creek, it is generally < 1 mg/L in water from the wells. It is believed that significant denitrification occurs in the anaerobic alluvial sediments underlying the wetland that separates the well field and Bazile Creek. Previous investigations have shown a significant annual spring flush of a variety of pesticides in Bazile Creek (Davis et al. 2000; Davis et al. 2001). However, no pesticides were detected in the monitoring wells installed along transects between the well field and Bazile Creek, or in the production wells. This is believed to be related to rapid degradation of pesticides in the highly anaerobic alluvial aquifer separating the creek from the well field.
Missouri River Alluvium
Previous investigations (Reclamation, 1994) were made to identify better source water for the Village of Santee. During the course of the study, it was determined that the Missouri River was supplying acceptable quality water to the nearby community of Springfield via a surface water diversion, and the community of Niobrara was receiving acceptable water from the alluvium near the mouth of the Niobrara River. Because those communities were obtaining relatively good quality water, it was anticipated that the Missouri River alluvium near the Village could also supply water of acceptable quality.
Accordingly, two test holes were installed in the Missouri alluvium in Sec. 14 of T. 33 N. - R. 5 W. One test hole encountered 92 feet of alluvial sand before terminating in the underlying Carlile Shale. Water samples were taken from the screened interval at 67 to 72 feet. The other test hole encountered 39 feet of alluvial sand before terminating in the Niobrara Formation. Water samples were collected from the screened interval between 34 and 39 feet. A sample analysis from each well indicated high TDS (2,420 – 2,604 mg/L) and high sulfate (1,150 – 1,330 mg/L). USGS theorized that water from the underlying Dakota Formation was seeping upward through the Niobrara and Carlile Formations into the alluvium. The investigation concluded that there was no definitive indication that the Missouri River alluvium, within the vicinity of the test holes, could provide any better quality water than the municipal wells were providing. It was speculated, however, that pumping nearer the surface of the alluvium (where water quality is more influenced by stream infiltration) could provide better quality water.
Scattered Individual Wells
Outside the Village and the Highway 12 and Howe Creek subdivisions, ground water is obtained from individual residential wells for domestic, stock watering, and irrigation purposes. According to the B&E Phase I report (1978), there were approximately 40 tribally or individually Indian-owned wells (most were domestic wells) and many more non-tribal or non-Indian owned domestic and stock watering wells. Most of those wells appear to be obtaining water from alluvial deposits along major drainageways. In areas where alluvial materials are not present or not of sufficient thickness, wells may be completed in the deeper Dakota Formation. Some of the wells tapping the Dakota Formation are artesian.
The registered ground-water well database, maintained by the Nebraska Natural Resources Commission, was searched for wells within the Reservation. The search produced a list of 20 registered wells: 16 irrigation wells and 4 domestic wells. The registered domestic wells had yields ranging from 13 to 15 gpm and depths from 39 to 175 feet. The registered irrigation wells had yields ranging from 370 to 750 gpm and depths ranging from 63 to 247 feet.
Of the 16 registered irrigation wells, 14 were located in the southern half of T. 31 N. – R. 4 W. The 14 wells had yields ranging from 400 to 750 gpm and well depths from 85 to 247 feet. Static water level depths ranged from 50 to 170 feet. These wells appear to be completed in Quaternary deposits, possibly a buried alluvial channel (USGS, 1995). Limited water quality data were available for these wells; however, analysis of one well sample obtained in the vicinity of the irrigation wells in July 1990 (USGS, 1995) indicated that the Quaternary deposits could supply acceptable water for municipal and domestic use. A nitrate level of 7.7 mg/L (although less than U.S. EPA’s MCL of 10 mg/L) possibly reflects a higher level of agricultural or livestock activity in this area than farther north on the Reservation. Three monitoring wells were installed in the Quaternary deposits in the southeastern portion of the Reservation in 2001. Water samples from these wells agree with data provided by USGS 1995. The water is generally higher quality (lower TDS) than water from other deposits throughout the Reservation. However, as noted, nitrate-N ranged from 5.3 to 10 mg/L. Water from one of the monitoring wells exceeded the 10 g/L MCL for arsenic with a concentration of 15 g/L (Davis et al. 2003).
One of the registered irrigation wells located just east of the Village of Santee in Sec. 13AB of T. 33 N. – R. 5 W. was completed to a depth of 63 feet in Pleistocene gravels overlying the Pierre Shale (Reclamation, 1994). This well produced 400 gpm. A water quality sample taken from this well in 1993 indicated poor quality water because of high TDS (1,768 mg/L) and high sulfate (870 mg/L).
Springs South of the Village of Santee
A series of springs several miles south of the Village produces acceptable quality water (Reclamation, 1994). These springs appear to be emanating at the contact zone of the Cretaceous shales and overlying Pleistocene sands and gravels. The volume of water available from these springs is not sufficient to meet the 2010 peak flow requirements of 360 gpm nor the 2040 peak flow requirements of 970 gpm projected needs for the tribal water system.
Alluvium in Southeast Reservation
Another area that could potentially supply a significant quantity of acceptable quality water is the Quaternary deposits (buried alluvial channel) located in the far southeast portion of the Reservation. Irrigation wells tapping these deposits are producing fairly high yields. Water quality samples taken from this area indicates the potential for acceptable quality water, although there may be potential for nitrate problems. Davis et al. (2003) prepared a ground-water model for this area to assess yield potential. Their findings indicate that the aquifer is capable of producing the required 400 gpm previously projected need for the tribal water system. They did however note that some sections went dry along the northern fringe of the unit under extensive pumping. Santee Sioux Nation currently has tribal land holdings only along this northern fringe of the aquifer. Considering that some of the fringe areas went dry under the 400 gpm pumping rate there is a real concern about the ability of this aquifer to provide sufficient water at the newly projected peak rate of 970 gpm. The ground-water flow model will be modified to reflect this new peak rate as part of the ongoing needs assessment and future feasibility study.
WATER SUPPLY AND TREATMENT
This chapter presents descriptions of the potable water supply systems for tribal communities within the Reservation. These descriptions are based on data compiled by the Santee-Sioux Land Management Office and the Tribal Utilities Office. Data for non-tribal communities (e.g., Lindy) were not available. Descriptions of tribal community systems are presented below, and the location of the Santee Sioux Reservation is shown on figure S-1 in the Executive Summary.
Village of Santee System
The Village of Santee potable water system supplies treated water to the Village and the tribal industrial park located along State Highway 12. The Village water supply comes from two 40 foot wells located in Quaternary alluvium along Bazile Creek. The pumps in these wells are individually rated at 125 and 75 gpm and can produce a combined flow rate of 200 gpm. The two municipal wells are part of a three-well system. The other well is not presently in use and can be tied into the Village system if necessary.
The source water for the wells is considered to be a mix of water from the Bazile Creek alluvium which is recharged primarily from Bazile Creek via induced infiltration. Water from the wells is injected with chlorine and sodium fluoride at the treatment building. The water travels to the Village through a 6-inch water main that parallels road S54D. The distribution system includes two buried water storage tanks with storage capacities of 20,000 and 60,000 gallons. Adjacent to the concrete 60,000-gallon tank is an 115,000-gallon bolted tank. The total existing storage capacity at the Village is approximately 195,000 gallons. The individual well pumps are activated by a water level sensor in the 20,000-gallon lead tank.
Water quality data for the Village system (table 8-1) indicate a substantial annual variation in some parameters. This variation results primarily from variations of the water quality in Bazile Creek and variable residence time in the alluvial aquifer under winter and summer pumping stresses. As indicated, concentrations of sulfate, TDS, hardness, and sometimes iron exceed secondary standards of the SDWA, resulting in poor water quality. Based on available data, the levels of coliform bacteria occasionally exceed SDWA primary MCLs, but with proper chlorination and chlorine contact time (achievable at the treatment building), these and other microorganisms will be deactivated before consumption. With the installation and proper operation of the chlorine booster station, adequate disinfection of potable water to Village residences down stream of the storage facility will be assured.
Service connections between the chlorine building and the first tribal storage tank, consisting of the Tribal Lands Office, casino, convenience store/gas station, and residential housing, depend on contact times in the chlorinated water distribution system to provide disinfection. Further investigation is required in the Feasibility Study to verify adequate chlorine contact times are provided.
Table 8-1. Village water system quality analysis
| Table 8-1. Village water system quality analysis | ||||
| Parameter | 1997 analysis1 (mg/L) |
1994 analysis2 (mg/L) |
2000 analysis3 (mg/L) |
SDWA level (mg/L) |
| Sodium | 47 | 95 | 105 | NA |
| Calcium | 244 | 564 | 506 | NA |
| Magnesium | 55.1 | Not analyzed | 188 | NA |
| pH units | 8.03 | 7.4 | 7.15 | 6.5 - 8.5 SMCL |
| Nitrate-N | Not detected | <0.1 | 2.3 | 10 |
| Sulfate | 531 | 1,330 | 1,882 | 250 SMCL |
| TDS | 996 | 2,604 | 1840 | 500 SMCL |
| Hardness | 48.9 | 1,824 | 119 | NA |
| Iron | 0.2 | 18 | 0.01 | 0.3 SMCL |
| Manganese | 0.04 | <0.1 | 0.00 | 0.05 SMCL |
| Chloride | 13 | 52 | 11 | 250 SMCL |
| Fluoride | 1 | 0.68 | 2.8 | 4.0 SMCL |
| Alkalinity | 274 mg/L CaCO3 | |||
| Bicarbonate | 334.28 mg/L HCO3 | |||
| Total coliforms | Not reported | 2.2/100 mL | 0/100 mL | 1 positive in 40 samples |
| Atrazine | Not detected | Not detected | Not detected | 0.003 MCL |
| Radon | Not tested | 117 pCi/L | Not detected | NA |
| Gross Alpha | Not tested | 10 pCi/L | Not detected | 15 pCi/L MCL |
| Radium (226) | Not tested | 0.2 pCi/L | Not detected | 5 pCi/L MCL |
The IHS in Sioux City, Iowa, indicates that two of the municipal wells routinely experience a reduction in yield because of iron bacterial buildup and require an acid treatment followed by chlorination to destroy the iron bacteria.
The Indian Health Service is of the opinion that the current wells, storage and distribution system have the capacity to meet existing and future demands of the Village of Santee and the chlorination of well water is adequate to meet the SDWA primary MCL’s. This will need to be confirmed in the future feasibility study The Indian Health Service acquired funding in fiscal year 2001 for a well investigation program with the goal of abandoning the existing wells in the Bazile Creek flood plain and drilling three new wells upgradient. This program was unsuccessful because no substitute water could be found. As a result, the casings of the existing wells were extended above the level of floodwater.
The now abandoned softening plant was built in 1995 with tribal funds and without IHS participation. This plant is located on the northern edge of the Village, and it was reported, by the operator of the plant, to reduce the hardness in the water from 685 mg/L to 170 mg/L. During the softening process, the plant consumed about 600 pounds of salt (sodium chloride) per day using Culligan ion exchange systems, which exchanged calcium in the water with sodium. The unit was rated at 120 gpm and treated 42,000 gallons between backwashes. (A backwash cycle produced 1,200 gallons of brine, consisting mostly of calcium chloride that was discharged to a depression west of the plant.) The softener was installed to reduce the amount of water heater replacement caused by scale buildup. Overall, this process increased the TDS in the softened water by as much as 20 percent. Water taps between the well house and the softening plant received unsoftened water, while service connections after the softening plant receive softened water. The abandoned softening plant has been recently converted to a chlorine booster station.
A record flood flow occurred in 1999 that inundated the well field. The wells, which at that time were only slightly above the floodplain, were flooded resulting in contamination of the public water supply by fecal coliform bacteria. Several months of cleanup were required to return the public water supply to full capacity. Emergency water was trucked in for an extended period during this crisis. Following this event, the wells were elevated above the floodplain to a height sufficient to avoid future inundation problems.
Lakeside Community
The Lakeside community is located east of the Village of Santee. Approximately 25 residences obtain untreated water from individual or shared wells located within the community. Water quality of these wells is shown in table 8-2. Parameters that exceed SDWA secondary standards include sulfate, TDS, and iron.
Table 8-2. Lakeside community typical water quality from wells
| Table 8-2. Lakeside community typical water quality from wells1 | ||
| Parameter | Concentration (mg/L) | SDWA level (mg/L) |
| Sodium | 65.1 | NA |
| Calcium | 275 | NA |
| Magnesium | 52.7 | NA |
| pH units | 7.43 | 6.5 - 8.5 SMCL |
| Nitrate-N | Not Detected | 10 SMCL |
| Sulfate | 824 | 250 SMCL |
| TDS | 1128 | 500 mg/L SMCL |
| Hardness | 52.9 | NA |
| Iron | 1.42 | 0.3 mg/L SMCL |
| Manganese | 0.17 | 0.05 SMCL |
| Chloride | 64 | 250 SMCL |
| Fluoride | 3.1 | 4.0 MCL |
| Total coliforms | Data not available | 1 positive in 40 samples MCL |
| Atrazine | Data not available | 0.003 MCL |
1 Inorganic analysis from Midwest Laboratories, Inc., Domestic Water Analysis Report, August 20, 1996.
Note: Bold indicates parameter above SDWA recommended level for potable water.
Highway 12 Housing Project
This cluster community lies east of road S54D and just north of Highway 12 and currently consists of seven homes. A well and pressure tank west of the development supplies untreated water to all the residents in the community. Water quality of the community well is provided in table 8-3. Parameters that exceed SDWA secondary standards include TDS and chlorides.
Table 8-3. Highway 12 housing project typical water quality from community well
| Table 8-3. Highway 12 housing project typical water quality from community well1 | ||
| Parameter | Concentration (mg/L) | SDWA level (mg/L) |
| Sodium | 394 | NA |
| Calcium | 41.4 | NA |
| Magnesium | 13 | NA |
| pH units | 7.78 | 6.5 - 8.5 SMCL |
| Nitrate-N | Not detected | 10 MCL |
| Sulfate | 5 | 250 SMCL |
| TDS | 1,450 | 500 SMCL |
| Hardness | 9 | NA |
| Iron | 0.24 | 0.3 SMCL |
| Manganese | 0.04 | 0.05 SMCL |
| Chloride | 694 | 250 SMCL |
| Fluoride | 1.6 | 4.0 MCL |
| Total coliform | Data not available | 1 positive in 40 samples MCL |
| Atrazine | Data not available | 0.003 mg/L MCL |
1 Inorganic results from Midwest Laboratories, Inc., Domestic Water Analysis Report, July 20, 1996.
Note: Bold indicates parameter above SDWA recommended level for potable water.
Table 8-4. Howe Creek project typical water quality from community well
| Table 8-4. Howe Creek project typical water quality from community well1 | ||
| Parameter | Concentration (mg/L) | SDWA level (mg/L) |
| Sodium | 11.6 | NA |
| Calcium | 228 | NA |
| Magnesium | 37.3 | NA |
| pH units | 7.22 | 6.5 - 8.5 SMCL |
| Nitrate-N | Not detected | 10 MCL |
| Sulfate | 406 | 250 SMCL |
| TDS | 775 | 500 SMCL |
| Hardness | 42.3 | NA |
| Iron | Not detected | 0.03 SMCL |
| Manganese | Not detected | 0.05 SMCL |
| Chloride | 5 | 250 SMCL |
| Fluoride | 0.9 | 4.0 MCL |
| Total coliform | Data not available | 1 positive in 40 samples MCL |
| Atrazine | Data not available | 0.003 MCL |
1 Inorganic results from Midwest Laboratories, Inc., Domestic Water Analysis Report, July 18, 1996.
Note: Bold indicates parameter above SDWA recommended level for potable water.
Howe Creek Community
The cluster community of Howe Creek consists of five homes. The homes receive untreated water from an alluvial well and community distribution system. The wellhead is located approximately 50 feet from Howe Creek. Water quality of the community well is shown in table 8-4. Parameters exceeding SDWA secondary standards include sulfates and TDS.
Rural Tribal Lands
Homes located on rural tribal lands are on individual well systems, except for the Leila James residence, which is served by the West Knox Rural Water System. The quality of rural water varies throughout the Reservation and appears to be a function of the amount and quality of water withdrawn from the Dakota formation, the amount and quality of the water taken from the alluvium, and the proximity of the wells to sources of contamination.
Assessment
From this discussion, it is apparent that water consumed by the majority of the tribal members is properly disinfected to remove pathogens. Of concern with respect to potential contamination are the communities of Howe Creek and the Lakeside which do not chlorinate the water. In almost all communities, the drinking water quality does not meet secondary limits with regards to sulfates, total dissolved solids and iron. Water supply alternatives discussed in Chapter 10 will provide clean drinking water to all Reservation occupants with a quality that will meet the primary and secondary standards of the EPA as mandated by the Safe Drinking Water Act.
Representative Water Quality by Aquifer and Region Within the Reservation Figure 8-1 is a trilinear (Piper) plot for ground water within the Reservation. This plot shows the variation of water quality for wells withdrawing water from three distinct aquifers within the Reservation. The green rectangles represent water from the Dakota Formation which is generally high in either sulfate or chloride. Blue circles with a cross represent waters from relatively thin alluvial deposits that directly overlie the Pierre Shale. These tend to be higher in sulfate than other alluvial waters. The third group, shown as red open circles, represent water from alluvial deposits principally in the east-central and southeastern portion of the Reservation. Figure 8-2 illustrates the spatial distribution of these water types throughout the Reservation. Tables 8-5 through 8-7 provide water quality statistics for wells drawing water from these three aquifers.
Figure 8-1. Piper plot ground water, Santee Sioux Reservation.
Estimate of Future Water Demands
This chapter provides projected water demands for the Reservation as a whole, and for the Reservation, along with the towns of Niobrara and Center. The communities of Center and Niobrara were included in this analysis as requested by the Tribe.
Future Water Demands
Future potable water demands for the Reservation are presented in table 9-1, and future potable water demand for both the Reservation and the surrounding villages of Center and Niobrara are shown in table 9-2. Estimates are based on the population projections provided in Chapter 5 of this report. The calculated water demand is based on a per capita residential consumption rate of 100 gpd, 18 gpd per head for bison ranching, 12 gpd per head for cattle ranching, and for commercial rates as indicated in table 9-1. Properly sized water storage tanks would provide adequate water for peak hour demands.
Table 9-1. Current and future water demand for Santee Indian Reservation
| Table 9-1. Current and future water demand for Santee Indian Reservation | |||||||||
| Activity or land use | Current number |
Current usage (gpd) | Current demand (gpd) | Year 2010 number | Year 2010 usage (gallons per capita) | Year 2010 demand (gpd) | Year 2040 number | Year 2040 usage (gal per capita) | Year 2040 demand (gpd) |
| Population1 | 1,060 people | 100/person | 106,000 | 1,190 | 100 | 119,000 | 2,200 | 100 | 220,000 |
| Golf course irrigation2 | 0 | N/A | 0 | 0 | N/A | 0 | 50 acres | N/A | 244,000 |
| Casino | 1 | N/A | 50,000 | 1 | N/A | 60,000 | 1 | N/A | 100,000 |
| RV park | 0 | N/A | 0 | 0 | N/A | 0 | 50 spaces | N/A | 5,500 |
| Hotel | 0 | N/A | 0 | 0 | N/A | 0 | 100 rooms | N/A | 10,000 |
| Strip mall | 0 | N/A | 0 | Prorated | N/A | 11,500 | 9 units | N/A | 22,900 |
| Community center | 0 | N/A | 0 | Prorated | N/A | 8,900 | 2-acre park and 10,000-square-foot pool | N/A | 17,700 |
| Ranching - bison | 100 head | 18 gpd per head | 1,800 | 120 head | 18 gpd per head | 2,160 | 200 head | 18 gpd per head | 3,600 |
| Ranching-cattle | 800 head | 12 gpd per head | 9,600 | 840 head | 12 gpd per head | 10,080 | 1,000 head | 12 gpd per head | 12,000 |
| Light industry3 | 0 | N/A | 0 | 0 | N/A | 0 | 1 | N/A | 5,300 |
| Gas station/ convenience store |
0 | N/A | 0 | 1 | N/A | 900 | 1 | N/A | 900 |
| Total estimated average flows | 167,400 | 212,540 | 641,900 | ||||||
| Peak day flows4 (using multiplier of 2.0) | 334,800 | 425,080 | 1,283,800 | ||||||
1 Population growth data were taken from table 5-4, assuming an Indian net migration of 1.0 percent. 2 Value was estimated using a 180-day irrigation season. 3 Assuming 35 employees. 4 Peak day flows account for worst case scenario, including water use for landscaping and hot summer days. |
|||||||||
Table 9-2. Future water demand for Santee Indian Reservation and surrounding communities.
| Table 9-2. Future water demand for Santee Indian Reservation and surrounding communities | ||
| Source | Water demand 2010 (gpd) |
Water demand 2040 (gpd) |
Reservation Residential water demand4 Golf course Casino RV park Hotel Strip mall Community center Bison ranching Cattle ranching Light industry Gas station Total average demand1 Total peak day demand1 |
119,000 N/A 60,000 N/A N/A 11,500 8,900 2,160 10,080 N/A 900 213,000 gpd 426,000 gpd |
220,000 244,000 100,000 5,500 10,000 22,900 17,700 3,600 12,000 5,300 900 642,000 gpd 1,284,000 gpd |
Village of Niobrara Average water demand2 Peak day water demand3 |
365 residents 37,000 gpd 74,000 gpd |
325 residents 33,000 gpd 66,000 gpd |
Village of Center Average water demand2 Peak day water demand3 |
100 residents 10,000 gpd 20,000 gpd |
185 residents 19,000 gpd 38,000 gpd |
Total average demand Total peak demand |
260,000 gpd 520,000 gpd (360 gpm) |
694,000 gpd 1,400,000 gpd (970 gpm) |
1 Data taken from table 9-1 and rounded to the nearest 1,000 gallons.
2 Average demand based on 100 gpd per capita and rounded to the nearest 1,000 gallons.
3 Peak demand based on a peak day factor of 2.
4 These numbers are taken from the population projections and analysis (Chapter 5).
Assessment
Between 2010 and 2040, water demand more than doubles. This increase in water demand is due to the increasing population and commercial areas on the Reservation. Chapter 10 provides descriptions of six water supply alternatives to meet future demands.
The use of potable water to irrigate the proposed golf course in the year 2040 may not be the best use of available resources. Future studies are needed to see if this demand could be satisfied by the reuse of treated wastewater, the use of untreated ground water or surface water from sources in the vicinity of the golf course, or a combination of these.
Reservationwide Water Supply Alternatives
This chapter explores six water supply alternatives capable of meeting year 2040 water demands and SDWA current water quality criteria on the Reservation. Alternatives 1-4 include the Reservation and the surrounding communities of Niobrara and Center. Alternatives 5 and 6 address the Reservation only.
For the purpose of analysis, source supply and treatment facility descriptions are provided to meet the 2010 and 2040 demands. The distribution systems are sized to meet the demands in the year 2040.
Cost Estimates
Cost estimates presented at the end of each alternative represent current capital and operation and maintenance costs to meet the water demand requirements in the year 2040.
Appraisal-grade capital cost estimates for wells, treatment plants, water mains, water storage tanks, and distribution lines for alternatives 1-4 are provided in attachment 1. Updated cost estimates, where available, from Cedar Knox Rural Water Project and West-Knox Rural Water System are included in attachment 1, along with supporting documentation. Appraisal-grade estimates are preliminary or “rough” estimates made at the outset of a planning investigation.
In developing the water supply alternatives, the location and cost for individual service connections were not included in cost estimates. Additionally, the abandoned Village water softening system was not considered to be needed for any of the supply alternatives.
Fire Flow
Although adequate volume of water may be provided in the existing and future treated water storage tanks, additional research is required in the feasibility study to determine if the existing infrastructure is adequately sized to deliver and pump the required water for a fire located in any area of the Reservation.
Treated Water Storage
In the updated reported, alternatives 1-4 will have backup power and are designed with a backup well or multiple treatment trains to reduce or eliminate the potential loss of water service. That being the case, treated water storage in the first four alternatives will be based on the peak day demand in the year 2040: 1,390,000 gallons, plus 2,000 gallons (4 hours at 500-gpm fire storage).
The only treated water storage tank currently located on the Reservation is a 237,000-gallon tank and is located in the Village of Santee, as discussed in Chapter 8. To meet the 2040 requirement of 1,390,000 for the Reservation, Niobrara, and Center, an additional 1,153,000 gallons of storage must be provided. Using 100,000-gallon elevated storage tanks to meet this requirement, approximately 12 storage tanks will be required by the year 2040. The appraisal level cost of these 12 new storage tanks is included in the capital cost in alternatives 1-4 as discussed below. The location and cost for additional storage in alternatives 5 and 6 is not considered in this study and will need to be determined in the feasibility study.
Alternative 1: Installation of a Well Field in the Southeast Corner of the Reservation
Based on data from the 1995 USGS Administrative Report (1995), the U.S. EPA funded 106 Tribal Water Quality Management program, and as discussed in Chapter 7 of this report, ground water in the southeast corner of the Reservation may potentially be able to supply adequate quality and quantity to meet existing and future Reservationwide demands with the exception of elevated concentrations of nitrate-N. As shown in table 10-1, the water quality meets SDWA criteria for both primary and secondary MCLs, except nitrate-N. One sample exceeded the MCL and the other samples were elevated (5 to 10 mg/L). The aquifer in this portion of the Reservation extends to the south beyond the southern boundary of the Reservation and is the same aquifer that provides water to the City of Creighton, Nebraska. This aquifer has experienced increasing nitrate-N impact over time. The City of Creighton has recently installed additional treatment capacity to reduce concentrations of nitrate-N below the MCL. A recent report by the Nebraska Department of Environmental Quality indicates that nitrate-N in this part of the Bazile Creek basin typically ranges from 5 to 20 mg/L with several sites in excess of 20 mg/L (Nebraska Department of Environmental Quality, 2002). Installation of three 200-gpm wells (two active and one backup) would be required to meet year 2010 peak day demand projections, and an additional three 200-gpm wells (five active and one backup) would be required to meet 2040 peak day demand. Following chlorination and fluoridation, the water would be conveyed via a 10-inch water main from the wellhead to State Highway 12, then along the road right-of-way from the eastern edge of the Reservation to the existing Village treatment building where booster pumps would lift water to the Village system. En route, distribution lines would branch off the main to serve the Howe Creek and Highway 12 subdivisions, the villages of Niobrara and Center, and rural residences. Under this alternative, the Village system would be expanded to serve the Lakeside area. A potential pipeline alignment is shown in figure 10-1 (figures appear at the end of this chapter).
Ground-water modeling for the area was completed as part of the U.S. EPA funded 106 Tribal Water Quality Program. Results of the model indicate that this aquifer is capable of yielding sufficient water at a proposed rate of 400 gpm in the 1997 assessment report (see previous note in Chapter 7 regarding increased projections of peak demand and the need for modification of the existing ground-water flow model to incorporate these new projected peak needs) to meet the needs for the proposed water system except along the northern fringe of the unit where the sands and gravels thin or pinchout (Davis et al. 2003). Santee Sioux Nation currently only owns property at this very northern fringe. Ownership or access to land south of the current holdings would be required to make this a viable water supply option.
Operational requirements of this alternative would be similar to the existing Village well system; however, due to the isolation of the wellhead, well pumps and control operations would have to be remotely monitored by a supervisory control and data acquisition (SCADA) system.
The appraisal capital cost estimate for this option, including treated water storage, is $14,000,000.
Table 10-1. Reservationwide Alternative 1, quality of delivered water1
| Table 10-1. Reservationwide Alternative 1, quality of delivered water1 | ||
| Parameter | Concentration (mg/L) |
MCL or SMCL (mg/L) |
| Sodium | 14 | NA |
| Calcium | 77 | NA |
| Magnesium | 18 | NA |
| pH | Not available | 6.5 – 8.5 SMCL |
| Nitrate-N | 7.7 | 10 MCL |
| TDS | 366 | 500 SMCL |
| Hardness | Not available | NA |
| Iron | <.003 | 0.3 SMCL |
| Chloride | 5 | 250 SMCL |
| Alkalinity | 259 | NA |
| Sulfate | 14 | 250 SMCL |
| Fluoride | 0.2 | 4.0 MCL |
| Arsenic | 0.006 | 0.01 MCL |
| Manganese | 0.02 | 0.05 SMCL |
| Selenium | 0.005 | 0.05 MCL |
| Boron | 0.04 | NA |
1 Data for well GW-2 are shown in USGS (1995), pages 38-39.
Alternative 2: Tribal Surface Water Treatment Plant at Bazile Creek
In this alternative, surface water would be drawn directly from Bazile Creek, south of the existing water treatment building, and treated by chemical/physical means to meet Surface Water Treatment Rule (SWTR) requirements of SDWA. Quality of Bazile Creek water before treatment is shown in table 10-2. Adequate flow exists in Bazile Creek to support the 400-gpm previous projected need in the 1997 assessment report. (See previous note in Chapter 7 regarding increased projections of peak demand and the need for modification of the existing ground-water flow model to incorporate these new projected peak needs). Average low flow in Bazile Creek is 40 cubic feet per second while the average high flow is 70 cubic feet per second. The proposed 970 gpm production rate for the water system represents about 5 percent of the average flow in Bazile Creek. Availability of water rights to produce this water is undetermined.
More problematic is the long term viability and stability of the intake structure. As discussed in Chapter 7, many physical structures have been impacted by sedimentation and stream aggradation in the lower reaches of Bazile Creek. Channel morphology is continually changing as this portion of the creek undergoes transformation from a tributary stream to a distributary delta building system.
Another concern is the nitrate-N load and pesticide load in the stream. Figure 10-2 shows the concentration of nitrate-N for several Reservation streams on a quarterly basis for 1998. In Bazile Creek these concentrations typically range from 4 to 9 mg/L. Figures 10-3 and 10-4 show concentrations of selected pesticides in Reservation streams for a period in June 1998. These data indicate exceedance of the MCL for atrazine for at least a 3-day period. This flushing of pesticides is an annual spring event.
If creek water is available, a new water treatment plant with an intake line from Bazile Creek under State Highway 12 would be located in the area of the existing treatment building. After treatment and storage, treated water would be pumped to the existing Village conveyance system, then through a new 10-inch main along State Highway 12 to the Highway 12 subdivision. Distribution lines would branch off this line to serve the Howe Creek subdivision, villages of Niobrara and Center, and rural residences. In this alternative, the Village treated water conveyance system would be expanded to serve the Lakeside area. The proposed pipeline location is shown in figure 10-2.
Based on population projections, a 520,000-gpd treatment plant will be required to meet the peak day demand in the year 2010. In 2040, this plant would require upgrading to treat water at a rate of 1,400,000 gallons per day. The required water treatment process (figure 10-3) would remove color, suspended solids, and microorganisms (e.g., Giardia and Crypto sporidium). The presence of Atrazine above the MCL will require a carbon adsorption step. Further analysis of the water would be required to determine the potential for production of disinfection products with the treatment process proposed. The appraisal cost estimate is that of an Actifloc physical-chemical treatment plant (see attachments 1 and 2). An alternative to this system is the use of a microfiltration system, followed by chlorination and detention.
Treated water from Bazile Creek would meet primary and secondary MCL requirements of SDWA. A new water storage tank would have to be installed adjacent to the treatment plant to meet the chlorine contact time of the SWTR of the SDWA.
Operation and maintenance costs would include chemicals, electrical consumption, and the need for full-time operators. The treatment plant would have to be operated by personnel qualified to meet the requirements of a Class II operator as stated in Title 120, Chapter 2 of the State Regulations Governing Public Water Supply Systems (179 NAC 2).
The capital cost of this alternative is $15,000,000. This cost does not include process units to remove Atrazine or other agricultural chemicals that may, in the future, migrate into the water flowing in Bazile Creek.
Table 10-2. Reservationwide Alternative 2, quality of Bazile Creek water before treatment
| Table 10-2. Reservationwide Alternative 2, quality of Bazile Creek water before treatment | |||
| Parameter | Concentration1,2 (mg/L) |
Concentration3 (mg/L) |
MCL or SMCL (mg/L) |
| Sodium | 17 | 25.7 | NA |
| Calcium | 72 | 108.2 | NA |
| Magnesium | 17 | 26.7 | NA |
| pH | 8.6 | 8.3 | 6.5 – 8.5 |
| Nitrate-N | 2.2 | 4.5 | 10 MCL |
| TDS | 339 | 495 | 500 SMCL |
| Hardness | 259 | 22.3 | NA |
| Iron | <.003 | 0.60 | 0.3 SMCL |
| Chloride | 8.4 | 10.0 | 250 SMCL |
| Alkalinity | 193 | 259 | NA |
| Sulfate | 67 | 130.5 | 250 SMCL |
| Fluoride | 0.3 | 0.3 | 4.0 MCL |
| Arsenic | 0.005 | Not tested | 0.01 MCL |
| Manganese | 0.014 | 0.10 | 0.05 SMCL |
| Selenium | 0.011 | Not tested | 0.05 MCL |
| Boron | 0.060 | Not tested | NA |
| Color | 14 platinum-cobalt units | Not tested | 15 SMCL |
| Fecal coliform | 160 colonies/100 mL | 200 cfu/100 mL | 1 positive in 40 samples MCL |
| Streptococci, fecal | 520 colonies/100 mils | Not tested | NA |
1 USGS (1995).
2 Data for well SW-1 are shown in USGS (1995), pages 30-31.
3 Data shown in University of Arkansas (2000), page 18.
Note: Bold indicates parameter above SDWA recommended level that would meet requirements after treatment.
Alternative 3: Tribal Surface Water Treatment Plant at the Missouri River
In this alternative, surface water would be drawn from the Missouri River in the location of the existing Village Aboat docks@ and treated by a new 520,000-gpd water treatment facility in 2010, and a 1,400,000-gpd water treatment facility in 2040, to meet requirement of SWTR. Similar to Alternative 2, the treatment process would remove color, suspended solids, and microorganisms. The treated water would meet SDWA primary and secondary MCL requirements. Further analysis of the water would be required to determine the potential for disinfection product formation with the proposed treatment process. This alternative would require the acquisition of Missouri River water rights by the Tribe.
As previously noted, a total of approximately 237,000 gallons of treated water storage is available in the vicinity of the Village of Santee. This includes the three current storage tanks with a total capacity of 195,000 gallons and the additional 42,000-gallon Aquastore tank that would be tied into the current distribution system. This tank was previously used in the now abandoned softening system.
Following treatment, water would be pumped to the Village storage tanks and then distributed to the other storage tanks in the system or directly to service via a new 10-inch main along State Highway 12, then to the Highway 12 subdivision. Distribution lines would branch off of this main line to serve the Howe Creek subdivision, villages of Niobrara and Center, and rural residences. (See the diagram of the Actifloc system in figure 10-3 and the proposal in attachment 2.) In this alternative, the Village treated water conveyance system would be expanded to serve the Lakeside area. The proposed pipeline routing is shown in figure 10-4.
Operation and maintenance costs would include chemicals, electrical consumption, and the need for full-time operators. The treatment plant would have to be operated by personnel who meet the requirements of a Class II operator, as stated in Title 120, Chapter 2 of the State Regulations Governing Public Water Supply Systems (179 NAC 2). This alternative may reduce pumping costs over other alternatives because most of the service connections will be downgradient from the treatment plant and existing water storage tanks.
The appraisal capital cost estimate of this alternative is $15,000,000.
Table 10-3. Reservationwide Alternative 3, quality of Missouri River water before treatment1
| Table 10-3. Reservationwide Alternative 3, quality of Missouri River water before treatment1 | ||
| Parameter | Concentration (mg/L) |
MCL or SMCL (mg/L) |
| Sodium | 62.1 | NA |
| Calcium | 70 | NA |
| Magnesium | 23.3 | NA |
| pH | 8.24 | 6.5 – 8.5 |
| Nitrate-N | 0.6 | 10 MCL |
| TDS | 491 | 500 SMCL |
| Hardness | 15.8 | NA |
| Iron | 0.53 | 0.3 SMCL |
| Chloride | 9 | 250 SMCL |
| Alkalinity | No analysis | NA |
| Sulfate | 223 | 250 SMCL |
| Fluoride | 0.4 | 4.0 MCL |
| Arsenic | No analysis | 0.01 MCL |
| Manganese | 0.04 | 0.05 SMCL |
| Selenium | NA | 0.05 MCL |
| Boron | NA | NA |
| Color | No analysis | 15 SMCL |
| Fecal coliform | No analysis | 1 positive in 40 samples MCL |
| Streptococci, fecal | No analysis | NA |
1 Inorganic analysis from Midwest Laboratories, Inc., Domestic Water Analysis, Sample ID 5-29-97 for surface water sampling point 5.
Note: Bold indicates parameter above SDWA recommended level that would meet requirements after treatment.
Alternative 4: Tribal Ground-Water Treatment Plant
In this alternative, the existing Village of Santee well field (three wells with a combined yield of 200 gpm) would be expanded to meet the year 2010 estimated peak day water demand of 520,000 gallons by the installation of two additional 200-gpm wells to increase the pumping capacity to 600 gpm with one backup well. The projected peak day water demand in year 2040 would require a total pumping capacity of 1,400,000 gallons or the installation of an additional five 200-gpm wells. One reserve well would be used when an active well requires maintenance.
As discussed in Chapter 7, the ground-water model developed for this site indicates that the aquifer is capable of yielding the 400 gpm demand projected in the 1997 report, but further modeling is required in the feasibility study to determine the ability to meet the revised 2040 demand of 970 gpm. Yield from the existing well field occurs primarily from induced recharge from Bazile Creek. The model results indicate that about 99 percent of the water produced is derived from flow in Bazile Creek. At the 1997 projected 400 gpm pumping rate this represents about 2 percent of the average flow in Bazile Creek. Particle tracking indicates that the average travel time from Bazile Creek to the production wells is about 255 days at 200 gpm and decreases to about 170 days at 400 gpm. Under the newly proposed peak rate of 970 gpm the observed lag times will be even shorter if the aquifer is even capably of producing at this rate. The travel times will need to be estimated when the ground-water model is modified to reflect these new higher rates as part of the ongoing needs assessment and future feasibility study. Anthropogenic water quality data suggests that contaminants such as pesticides and nitrate-N are being degraded in the anaerobic aquifer underlying the wetland that separates Bazile Creek and the well field. However, decreased residence time resulting from faster travel times or shorter travel distance may not be sufficient for this degradation to occur.
Water from the well field would be treated by reverse osmosis to achieve values below SDWA SMCLs. After treatment (and required residence time), water would be pumped to a new storage tank with the required capacity at the given time. The water would be pumped from the storage area at the wellhead (or relocated tank at the wellhead) for delivery to the existing Village conveyance system, a new 10-inch water main along State Highway 12. Once in this main, the water can be distributed as required to the Reservationwide distribution system and the villages of Niobrara and Center. In this alternative, the Village treated water conveyance system would be expanded to serve the Lakeside area. The proposed pipeline routing is shown in figure 10-5.
Using the year 2000 analysis in table 10-4, approximately 72 percent of the TDS in the water is sulfatic and/or calcitic compounds. A 920-gpm, reverse-osmosis treatment process would reject 90 percent of these compounds and would allow for the blending of 50 gpm of untreated well water. A flow diagram of the required treatment system is shown in figure 10-6. Blending with untreated water before chlorination would reduce the size and capital costs of the treatment system and would result in lower operation and maintenance costs, while still meeting SDWA requirements. The reject or concentrate stream from the reverse osmosis plant, estimated at 90 gpm at a TDS of 16,000 mg/L, would be pumped to the sewage lagoons for disposal. The introduction of this waste stream into the existing wastewater treatment system would not only change the characteristics of the treated wastewater but may violate the requirements of a discharge permit. Alternative methods to treat and dispose of concentrate will need to be developed in the future feasibility study.
Operation and maintenance costs for this alternative would include chemicals, electrical consumption, and the need for full-time operators. The treatment plant would have to be operated by personnel who meet the requirements of a Class II operator as stated in Title 120, Chapter 2 of the State Regulations Governing Public Water Supply Systems (179 NAC 2).
The appraisal capital cost estimate of this alternative is $16,000,000.
Table 10-4. Reservationwide Alternative 4, quality of ground water from the Village water system
| Table 10-4. Reservation-wide Alternative 4, quality of ground water from the Village water system | ||||
| Parameter | 1997 analysis1 (mg/L) |
1994 analysis2 (mg/L) |
2000 analysis3 (mg/L) |
SDWA level (mg/L) |
| Sodium | 47 | 95 | 105 | NA |
| Calcium | 244 | 564 | 506 | NA |
| Magnesium | 55.1 | Not analyzed | 188 | NA |
| pH units | 8.03 | 7.4 | 7.15 | 6.5 - 8.5 SMCL |
| Nitrate-N | Not detected | <0.1 | 2.3 | 10 |
| Sulfate | 531 | 1,330 | 1,882 | 250 SMCL |
| TDS | 996 | 2,604 | 1840 | 500 SMCL |
| Hardness | 48.9 | 1,824 | 119 | NA |
| Iron | 0.2 | 18 | 0.01 | 0.3 SMCL |
| Manganese | 0.04 | <0.1 | 0.00 | 0.05 SMCL |
| Chloride | 13 | 52 | 11 | 250 SMCL |
| Fluoride | 1 | 0.68 | 2.8 | 4.0 SMCL |
| Alkalinity | 274 mg/L CaCO3 | |||
| Bicarbonate | 334.28 mg/L HCO3 | |||
| Total coliforms | Not reported | 2.2/100 mL | 0/100 mL | 1 positive in 40 samples |
| Atrazine | Not detected | Not detected | Not detected | 0.003 MCL |
| Radon | Not tested | 117 pCi/L | Not detected | NA |
| Gross Alpha | Not tested | 10 pCi/L | Not detected | 15 pCi/L MCL |
| Radium (226) | Not tested | 0.2 pCi/L | Not detected | 5 pCi/L MCL |
1 From Domestic Water Analysis, Midwest Laboratories, Sample ID 072496W6 Hay Plant
2 For well DH-1 from Water Supply Investigation for the Village of Santee, Nebraska, June 1994.
3 Data shown in University of Arkansas (2000), page 69.
Note: Bold indicates parameter above SDWA recommended level for potable water.
pCi/L = picocuries per liter.
Alternative 5: Connection to the Cedar-Knox Rural Water Project
This alternative involves connecting a Reservationwide water distribution system only to the Cedar-Knox Rural Water Project delivery network. This alternative does not include supplying water to the town of Center or Niobrara.
The existing Cedar-Knox water treatment plant is at Devils Nest, northeast of the Reservation. This system treats water from the Missouri River to meet SWTR requirements of the SDWA requirements. An e-mail from Gene Schroeder, dated January 2, 2004, states that the currently available nonobligated capacity is 130,000 gpd (see attachment 3). According to table 9.2, Cedar-Knox’s available capacity is not adequate to meet the current peak day demand of 335,000 gallons or future demands.
In the subject e-mail, Mr. Schroeder stated, “To meet the 2010 and beyond demands, larger lines and more capacity would be needed with a cost of at least $6,000,000.” Further discussions are required for the feasibility study to better qualify and quantify the requirements and costs of this alternative and to determine the ability to provide water to towns of Center and Niobrara.
Using information provided in attachment 3, the Cedar-Knox Rural Water Project estimates total Reservationwide hookup fees of $6 million to fund construction of the treatment plant, water storage tanks, and a water main to the Reservation distribution system. Monthly water bills to residential users would include a base cost from $24 to $30, plus a flat rate of $4 per thousand gallons used per month.
The estimated capital cost of this system, including the hookup fees and the Reservationwide distribution system, is $13,800,000.
The annual operation and maintenance cost would be based on the monthly billing fees and could amount to $317,000 for the entire Reservation in the year 2010 (assumes five people per residence and the use of 15,000 gallons per month per residence).
Alternative 6: Connection to the West Knox Rural Water System
This alternative proposes connecting a Reservationwide water distribution system to the West Knox Rural Water System delivery network. This alternative does not include supplying water to the town of Center or Niobrara.
The West Knox Rural Water System takes its water from two wells (200 and 250 feet deep) west of the town of Creighton, at the junction of Highways 59 and 14, approximately 12 miles from the Reservation boundary. The system serves the town of Verdigre, Nebraska, and surrounding area.
The West Knox Rural Water System supplies water via a 2-inch pipe to various residences within the Reservation. According to a letter by Duane Filsinger, General Manager of the West Knox Rural Water System (attachment 4), the water authority has recently purchased an 80-acre tract of land and three exploratory wells have been dug (which produced promising results) within 1 mile of their storage tank, west of the town of Creighton, in Knox County, Nebraska. The West Knox Rural Water System feels capable of supplying the needs of Santee and anticipates an expansion of the system beyond the current well capacity and mainline service area (see water system boundary map - attachment 5).
The estimated capital cost of this alternative is $13,400,000. Detailed monthly billing rates were not provided but should be in the same range as the Cedar-Knox Rural Water Project (i.e., approximately $317,000 for Reservation residents in the year 2010).
Figure 10-1: Alternative #1 Routing
Figure 10-2: Alternative #2 Routing
Figure 10-3: Process Flow Diagram, Alternative 2 & 3
Figure 10-4: Alternative #3 Routing
Figure 10-5: Alternative #4 Routing
Figure 10-6: Treatment system conceptual design, Alt. 4
Figure 10-7: Alternative #5 Routing
Wastewater Treatment
This chapter briefly describes current wastewater treatment methods in use on the Reservation and suggests alternative means to remedy some apparent system deficiencies. This information is provided in the context of wastewater flows that potentially could be augmented under proposed water supply scenarios.
Existing Systems
Table 11-1 lists the types of wastewater treatment and disposal methods currently being used on the Reservation.
| Location | Type | Comments |
| Village of Santee | Evaporation lagoons | Undersized because of the loss of seepage flow as a result of recent lining. |
| Tribal Lands Office, casino, convenience store/gas station | Central collection point, followed by lift station to drain field located up gradient of the Casino. | Previous lagoons have been decommissioned to make way for expansion of convenience store/gas station. |
| Highway 12 subdivision | Individual septic tanks/disposal trenches in backyards | Appear to be working adequately, but three of the seven homes are showing signs of a failing drain field. |
| Howe Creek subdivision | Central septic tank and disposal fields | Appear to be working adequately. |
| Rural residents | Septic tanks and disposal fields | Minimum lot size is 1 acre for having both a well and drain field. |
Village of Santee
The Village wastewater collection, treatment, and disposal system consists of a gravity collection system, a submersible lift station, and a force main that pumps collected water to the newly sealed, three-cell, evaporation lagoon system through a new flow diversion structure. Most of the sewage collection and conveyance system was built in 1978.
In 1993, the three Village lagoons were reconditioned to reduce excessive seepage. As recommended in an alternative analysis done by the Indian Health Service (IHS, 1996), a bentonite clay liner was installed along the bottom and sides of each lagoon. The bentonite liner was engineered to allow 1/16 inch per day in the primary cell (cell 1) and 1/8 inch per day in the secondary cells (cells 2 and 3) to balance wastewater inflows and precipitation with evaporation. The percolation rate was not achieved and hydraulic overloading of the lagoons resulted, with potential for overtopping and downgradient flooding. To combat this threat, permission was granted by EPA for nonpermitted emergency point discharge from the lagoon system.
The IHS has $300,000 to build a 1.5-acre artificial wetland. Project completion is projected for summer 2004.
Tribal Lands Office, Casino and Convenience Store/Gas Station
Wastewater generated by the tribal lands office, casino and gas station is collected and pumped to a large leach field located up gradient of the Casino. The lagoons that historically collected the wastewater were decommissioned for expanding the gas station.
Information on the construction, dimensions, and operational requirements of these cells was not available.
Highway 12 Subdivision
The Highway 12 subdivision is served by individual septic tanks and leach fields. Three of the seven systems appear to be failing. Funding is being sought to construct a community drain field.
Howe Creek Subdivision
The Howe Creek subdivision uses a central septic tank and disposal fields. The system appears to be functioning adequately.
Rural Residences
Rural residences are served by septic tanks and disposal fields. These systems would have to be inspected individually. Such an inspection was beyond the scope of this study.
Corrective Action - Village of Santee
Option 1: Reconfigure Lagoon Interconnecting Piping to Reduce Short Circuiting
Because the lagoon system was not designed as a flowthrough system with a point discharge of treated water, there is a potential for discharging partially treated wastewater with the existing system of inlets, outlets, and drains. To meet discharge requirements, there is a need to reconfigure the existing distribution manhole, control structures, and drains to take full advantage of the area available for treatment and to reduce short circuiting in the lagoons. The new piping system must provide for serial flow between the wastewater lagoons with inlet and outlet control at opposite ends of each lagoon to reduce short circuiting. This flow regime, alone, may provide adequate detention time to meet discharge requirements. The need for surface aerators during the winter should be evaluated. The Tribe has applied to the U.S. EPA for a NPDES discharge permit.
Option 2: Construction of an Additional Evaporation Lagoon
Based on IHS calculations, an additional lagoon system with a surface area of 15.5 acres is required for complete evaporation of the generated wastewater. Because there is no room to expand in the area of the existing cells, an alternate location would have to be found.
Option 3: Construction of a Sewage Treatment Plant
A sewage treatment plant with a capacity of 60,000 gpd could be constructed adjacent to the existing lift station to treat domestic wastewater to secondary standards. Treated effluent could be pumped to the existing evaporation ponds for additional treatment or discharged directly into a stream or the Missouri River. There is a potential for reusing this treated water for irrigation or raising fish. Certified operators would be required to operate the wastewater treatment plant.
Option 4: Construction of an Artificial Wetland
The IHS has $300,000 to build a 1.5-acre artificial wetland. This wetland will increase evapotranspiration, as well as improve the quality of water discharged from the system. Project completion is scheduled for summer 2004.
Reservationwide Sewage Treatment Plant
Based on population projections, a 350,000-gpd regional wastewater treatment plant would be required by the year 2010. This plant would be adjacent to either Bazile Creek or the Missouri River and would include a network of force mains, lift stations, and gravity sewers to collect wastewater throughout the Reservation for treatment. The plant would require tertiary treatment (including filtration and nutrient reduction), and the effluent would be used for agriculture during the growing season or be discharged into Bazile Creek or the Missouri River. The plant would produce an organic sludge that could be used for fertilizer or dried and disposed of at the tribal landfill. This option is considered infeasible by the Indian Health Service because of the high cost of operation and maintenance.
References
B&E Engineering, Inc. Phase II Water Resource Inventory, Santee Indian Reservation. Draft copy prepared for Nebraska Indian Inter-Tribal Development Corporation. Yankton, SD. July 1981.
Gilat Planning and Research, Inc. A Study to Assess the Market for Affordable Housing Development on Santee Sioux Nation, Knox County, NE. December 2001.
Nebraska Agricultural Statistics Service. “2002 Nebraska Agricultural Statistics.” In cooperation with the Nebraska Department of Agriculture.” Lincoln, NE. August 2002.
Nebraska Department of Economic Development. NEDI Online. In cooperation with Nebraska Public Power District, Columbus, NE. http://sites.nppd.com.
University of Arkansas, Arkansas Water Resources Center. Assessment of Water Quality on the Santee Sioux Reservation, May 1998-1999 and Tribal Water Quality Management Plan. Fayetteville, AR. December 21, 2004.
University of Arkansas, Arkansas Water Resources Center. Baseline Assessment of Water Quality on the Santee Sioux Reservation, 1996-1997 and Framework for Tribal Water Quality Management Plan. Fayetteville, AR. June 1, 2000.
U.S. Bureau of the Census; 2000 Census of Population and Housing, Summary Tape File 3A (generated by Steven Piper using Census 2000 Gateway) http://census.gov/main/www/cen2000.html.
U.S. Department of Agriculture. “1997 Census of Agriculture.” Report AC97 – A – 27, Vol. A, Part 27: Nebraska State and County Data. National Agricultural Statistics Service. March 1999.
U.S. Department of Commerce. Fertility of American Women: June 2000. Issued October 2001. Washington, DC.
U.S. Department of Commerce. Net undercount of the 1990 Census. Undated.
U.S. Department of Commerce 1997. “County Business Patterns, Nebraska 1994.” U.S. Bureau of the Census, Washington DC.
U.S. Department of Health and Human Services. Indian Health Service. Regional Differences in Indian Health 2000 - 2001. Undated.
U.S. Department of Health and Human Services, Center for Disease Control and Prevention. National Vital Statistics Reports, Births: Final Data for 2000. Volume 50, Number 5. Feb. 12, 2002. Hyattsville, MD.
U.S. Department of Health and Human Services, Center for Disease Control and Prevention. Trends in Racial and Ethnic-Specific Rates for the Health Status Indicators: United States, 1990 - 1998. Statistical Notes: Number 23. Jan. 2002. Hyattsville, MD.
U.S. Department of Health and Human Services, Center for Disease Control and Prevention. National Vital Statistics Reports, Deaths: Preliminary Data for 2000. Volume 49, Number 12. Oct. 9, 2001. Hyattsville, MD.
U.S. Department of Health and Human Services, Center for Disease Control and Prevention. National Center for Health Statistics. National Vital Statistics System, Mortality, unpublished tables.

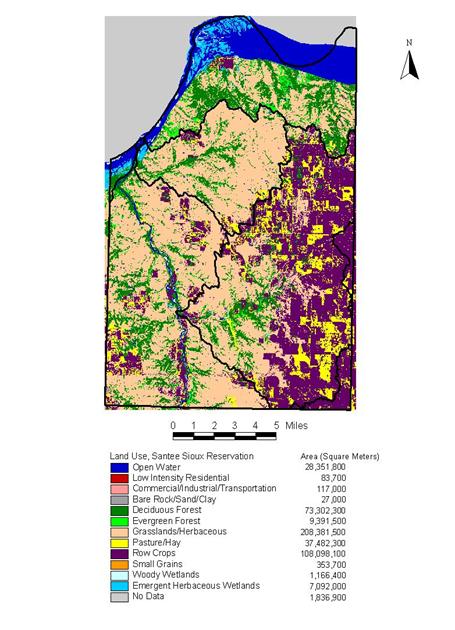
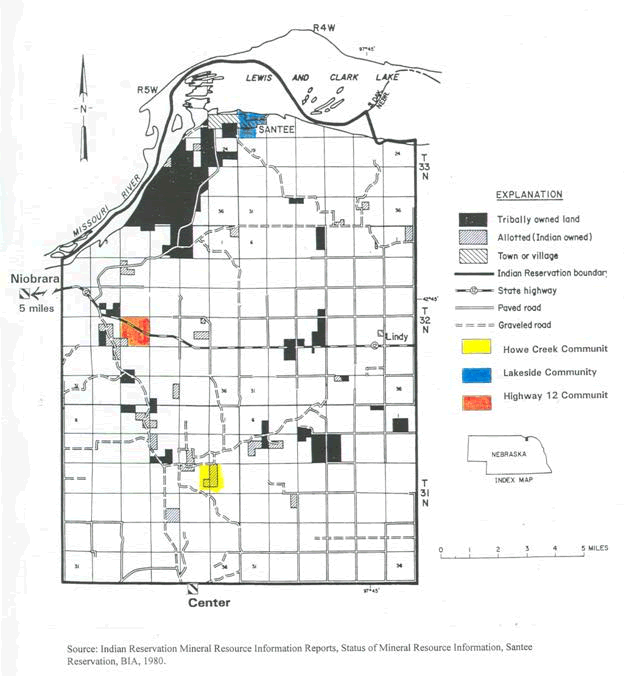