AgriMet Irrigation Guide
Irrigation Scheduling InformationSoil Water Storage Capacities
Root Zone Depths and Management Allowable Depletion for Selected Crops
Typical Irrigation Sytem Efficiencies
Nozzle Discharge vs. Pressure
Irrigation Application: Inches/Hour
"Wire-to-Water" Pumping Efficiency
Irrigation Scheduling
In arid regions such as the western United States, summer rainfall is insufficient to meet crop water demands. Irrigation is therefore necessary to make up the difference between available water and crop water demand. Crops use water from the soil profile by a process called "evapoptranspiration", or "ET" for short. ET is the combination of evaporation from the soil surface and transpiration of water through the plant's leaves. Plants will take up water from the soil profile by the plant roots to replace the water lost from transpiration. As soils become dryer, the soil moisture is more difficult for the plant roots to obtain. At some point (just after the management allowed depletion level), the plant becomes stressed. As the soils become even drier, the plant will eventually reach its permanent wilting point.
Scientific irrigation scheduling is a general term describing various techniques to deliver the right amount of water to the plants at the right time. One of the simplest forms of scientific irrigation scheduling is called the "checkbook method". It is so named because of its similarity to balancing a checking account. In this case, however, we are balancing available water in the soil moisture account, not dollars in a checking account. Evapotranspiration accounts for the withdrawals from the soil moisture account, and irrigation or effective natural rainfall are the deposits to the account.
Good irrigation scheduling means applying the right amount of water at the right time---in other words, making sure water is available when the crop needs it. Scheduling maximizes irrigation efficiency by minimizing runoff and percolation losses. This often results in lower energy and water use and optimum crop yields, but can result in increased energy and water use in situations where insufficient water was being applied. Good irrigation scheduling also maximizes the use of fertilizers by not "pushing" the nutrients down below the root zone due to deep percolation from over-irrigation.
Scientific irrigation scheduling requires the knowledge of several factors:
1) Soil Water Storage Capacities (The amount of water available to the plant, typically expressed in inches/foot). This information is usually available from county Soil Survey maps published by the USDA Natural Resources Conservation Service. The table below lists average ranges of soil water storage capacities for common soil types.
2) Root Zone Depth for your crops. Remember that this depth will change as the crop grows. You can monitor the depth of your crop's roots during the growing season, or the table below will give you some average values. Remember that 80 to 90 percent of a plants feeder roots are contained in the upper 60-75 percent of the root zone.
3) Management Allowable Depletion. This value, expressed in percent, is the portion of water in the root zone that plants can utilize before experiencing stress.
4) Daily Estimates of Crop Water Use. The AgriMet system provides this information on a daily basis in our Crop Water Use Charts. AgriMet uses the 1982 Kimberly-Penman Evapotranspiration Model, combined with locally derived plant growth stage information, to produce estimates of daily crop consumptive water use.
5) Efficiency of your Irrigation System. Combining the information above will give you the net irrigation requirement, or how much water you need to return to the plant root zone in order to replace the water used by the plant through evapotranspiration. Typically, you measure your water before it goes into your irrigation system. Because of various inefficiencies in the system, not all the water makes it to the plant root zone where it is needed. The table below gives application efficiencies for various irrigation methods. The wide ranges are primarily due to variations in maintenance, wind, temperature, and humidities encountered during irrigation.
Soil Water Storage Capacities
The texture of soil to be irrigated is very important in determining when and how much to irrigate. This table lists the abilities of different soil types to store and make water available to plants.
| Soil | Available Moisture per foot |
|
| General Description | Texture Class | |
| Light, Sandy | Coarse Sand | 0.7 inches |
| Fine Sand | 0.9 | |
| Sandy Loam | 1.2 | |
| Medium, Loamy | Fine Sandy Loam | 1.5 |
| Loam | 1.8 | |
| Silt Loam | 2.0 | |
| Heavy, Clay | Clay Loam | 2.2 |
| Clays; Peats/Mucks | 2.4 | |
*Values are for deep, uniform soil profiles. Layering or changes in soil texture within the profile may increase or decrease effective available water.
Root Zone Depths and Management Allowable Depletion for Selected Crops
The plant root zone determines the soil depth from which the crop can draw moisture. This table shows the root zones that mature crops depend on for 90% of their water needs, and the percent of total available moisture that crops can withdraw without suffering stress or yield loss. This percent is also referred to as "Management Allowed Depletion", or MAD.
| Crop | Root Zone* (ft) |
Time to Reach Mature Root Zone |
Allowable Depletion (%) |
| Alfalfa | 4.0 | 0 | 55 |
| Pasture/Turf | 2.0 | 0 | 50 |
| Small Grains | 3.0 | heading | 55 |
| Beans | 2.5 | 50 days after plant | 40 |
| Corn | 3.0 | 10 days after tassel | 50 |
| Potatoes | 2.0 | 80 days after plant | 35 |
| Sugar Beets | 3.0 | 110 days after plant | 50 |
| Orchard | 6.0 | 0 | 50-65 |
| Grapes | 3.0 | 0 | 65 |
*Root zones can be limited by shallow soils, compaction layers and dry soil.
Irrigation System Attainable Application Efficiencies
| Irrigation Method | Efficiency (Percent) |
| Solid Set | 70 - 85 |
| Hand Move | 65 - 85 |
| Side-Roll | 65 - 85 |
| Traveling Gun | 60 - 75 |
| Center Pivot | 75 - 90 |
| Linear Move | 75 - 90 |
| LEPA | 80 - 90 |
| Row Crop Drip | 85 - 90 |
| Drip | 85 - 90 |
| Microspray | 85 - 90 |
| Bubbler: Low Head | 80 - 90 |
| Border Strip | 55 - 90 |
| Furrow: Modern | 60 - 90 |
| Furrow | 50 - 80 |
These values represent the range of efficiencies that should be obtained with correct design and management of the indicated irrigation method. The ranges allow you to make allowances for system configuration and local conditions. For example, if the climate is humid, temperatures are mild, and winds are moderate you might assume an application efficiency of 80% for a side roll system with closely spaced impact sprinklers. For the same system operating in an arid climate with wide sprinkler spacing, you might assume an efficiency of 65%.
Nozzle Discharge vs. Pressure for Various Nozzle Sizes
| Nozzle Discharge - Gallons per Minute | ||||||||
| p.s.i. | 3/32 | 1/8 | 9/64 | 5/32 | 11/64 | 3/16 | 13/64 | 7/32 |
| 20 | 1.17 | 2.09 | 2.65 | 3.26 | 3.92 | 4.69 | 5.51 | 6.37 |
| 25 | 1.31 | 2.34 | 2.96 | 3.64 | 4.38 | 5.25 | 6.16 | 7.13 |
| 30 | 1.44 | 2.56 | 3.26 | 4.01 | 4.83 | 5.75 | 6.80 | 7.86 |
| 35 | 1.55 | 2.77 | 3.50 | 4.31 | 5.18 | 6.21 | 7.30 | 8.43 |
| 40 | 1.66 | 2.96 | 3.74 | 4.61 | 5.54 | 6.64 | 7.80 | 9.02 |
| 45 | 1.76 | 3.13 | 3.99 | 4.91 | 5.91 | 7.03 | 8.30 | 9.60 |
| 50 | 1.85 | 3.30 | 4.18 | 5.15 | 6.19 | 7.41 | 8.71 | 10.10 |
| 55 | 1.94 | 3.46 | 4.37 | 5.39 | 6.48 | 7.77 | 9.12 | 10.50 |
Irrigation Application - Inches per Hour
| Sprinkler Spacing |
Gallons Per Minute/Sprinkler | ||||||||||||||
| 2 | 3 | 4 | 5 | 6 | 7 | 8 | 9 | 10 | 11 | 12 | 15 | 18 | 20 | 25 | |
| 30x30 | .21 | .32 | .43 | ||||||||||||
| 30x40 | .16 | .24 | .32 | .40 | .48 | .52 | .64 | .72 | |||||||
| 30x50 | .25 | .32 | .38 | .44 | .51 | .57 | .64 | .70 | .76 | ||||||
| 30x60 | .27 | .32 | .37 | .43 | .48 | .53 | .58 | .64 | .80 | ||||||
| 40x40 | .18 | .24 | .30 | .36 | .42 | .48 | .54 | ||||||||
| 40x50 | .24 | .29 | .33 | .38 | .43 | .48 | .53 | .58 | |||||||
| 40x60 | .20 | .24 | .28 | .32 | .36 | .40 | .44 | .48 | .60 | .72 | .80 | ||||
| 50x50 | .23 | .27 | .31 | .35 | |||||||||||
| 50x60 | .19 | .22 | .26 | .29 | .32 | .35 | .39 | .48 | .58 | .64 | |||||
| 50x70 | .19 | .22 | .25 | .28 | .30 | .33 | .41 | .49 | .55 | .69 | |||||
| 60x60 | .21 | .24 | .27 | .29 | .32 | .40 | .48 | .53 | .67 | ||||||
| 60x70 | .20 | .23 | .25 | .27 | .34 | .41 | .46 | .57 | |||||||
| 60x80 | .20 | .22 | .24 | .30 | .36 | .40 | .50 | ||||||||
Wire-to-Water Pump Efficiency
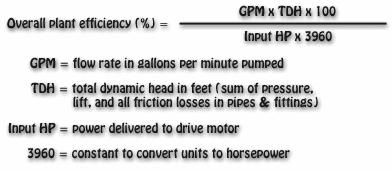
The overall or "wire-to-water" efficiency of a pumping plant is the ratio of work done by a pumping plant to the energy put into the pump. The pumping plant is defined as the pump and motor plus all associated fittings from the water source through the pump to the discharge into the irrigation distribution system. Efficiency is expressed by the following equation:


