CRMMS Visualization Tool
The CRMMS Visualization Tool provides a graphical representation of reservoir condition projections from the Colorado River Mid-term Modeling System (CRMMS) for a given initialization month. The tool displays projections from CRMMS for both the 24-Month Study (24MS) mode and the ensemble mode. Both 24MS and ensemble modes are driven with input hydrologies produced by the Colorado Basin River Forecast Center (CBRFC). The 24MS Most Probable projections are available every month, with Minimum and Maximum Probable projections available in January, April, August, and October, representing the 90% and 10% exceedance streamflow forecasts for the first year of the simulation and the 75% and 25% exceedance streamflow forecasts for the second year, respectively. When the Drought Response Operations Agreement is triggered, all three 24MS inflow scenarios are published each month. Probabilistic results from ensemble mode are driven with 35 Ensemble Streamflow Prediction (ESP) traces, created using a hydrologic model initialized with current basin conditions and simulated with historical weather (i.e. temperature and precipitation) from 1981 to 2015. For more information about CRMMS simulations, see this website.
CRMMS projections from 24MS mode (CRMMS-24MS) and ensemble mode (CRMMS-ESP) can be viewed on the same charts and are updated monthly, normally by mid-month. CRMMS-24MS results are used to make official operational decisions. Reservoir operations are manually input by operators. CRMMS-ESP projections are used for risk-based operational planning and analysis, with reservoir operations solved for using RiverWare rules. CRMMS-ESP projections are developed by running CRMMS with 35 ESP traces, with each trace labeled based on the historical year the forcings represent. Statistics are calculated from CRMMS-ESP output, including the 10%, 25%, 50% (median), 75%, and 90% exceedance probabilities, along with the minimum, maximum, and mean. The CRMMS-24MS Most Probable and CRMMS-ESP median should be similar, though reservoir operations may differ since they are manually input by an operator in CRMMS-24MS, while being solved for by operational rules in CRMMS-ESP.
Using the Tool
A user can choose a current or historical CRMMS initialization month on the navigator page. Specific reservoirs can be chosen from a drop-down menu, which navigates to charts for the specified reservoir. Selecting the Site Map will navigate to a map of the Colorado River Basin, with the twelve modeled reservoirs represented as blue pins. Choosing a reservoir from the map view will open a pop-up window with an overview of reservoir inflow, storage, and outflow. Individual reservoir variables can be selected on the left panel, along with options to download the data in JSON or CSV formats. To see the charts in a full screen view, click the reservoir name in the upper left corner.
Reservoir Charts
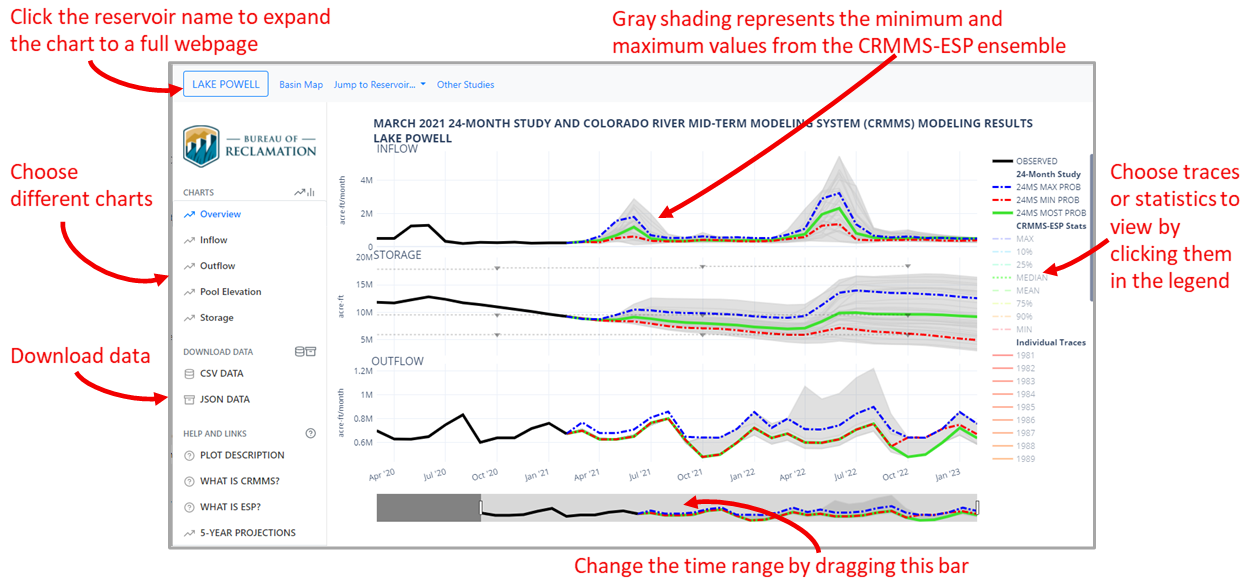
The dashboard initially shows an overview with charts of reservoir inflow, storage, and outflow. Other variables can be chosen from the left panel. The charts contain observations and projections from both CRMMS-ESP and CRMMS-24MS. The time range shown on the chart can be modified by changing the range selector shown at the bottom of the dashboard. Mouse over the chart(s) to view traces and values. The legend on the right shows all possible traces and statistics that can be displayed on the chart.
Legend Details
Individual traces from the CRMMS-24MS and CRMMS-ESP simulations can be toggled on and off in the legend by clicking the individual trace or statistic name. A double click on the legend will toggle all traces on and off, except the clicked trace. The default chart shows observed data, the 24MS Minimum Probable, Most Probable, and Maximum probable traces; the full range (minimum to maximum) of CRMMS-ESP traces, which are represented by the gray shaded region; and every individual trace from CRMMS-ESP as gray lines. The data always represent end-of-month or monthly total values. The lines, or traces, are described below:
- Observed: Observations of variables represented in the chart for the 12 months preceding the run.
- 24-Month Study The 24MS Most Probable trace (24MS Most Prob) is shown every month. The Minimum and Maximum Probable are shown in January, April, August, October, and when necessary due to the Drought Response Operations Agreement. The Minimum and Maximum Probable 24MS projections represent the 90% and 10% exceedance streamflow forecasts produced by the CBRFC for the first year of the simulation and the 75% and 25% exceedance streamflow forecasts for the second year, respectively.
- CRMMS-ESP Stats: CRMMS statistics calculated from running ESP traces: maximum, median, mean, minimum, and 10%, 25%, 75%, and 90% exceedance probabilities.
- Individual Traces: CRMMS-ESP traces are labeled by the historical year that informed the first year of the ESP hydrology trace.
Annotated screen shot of an overview dashboard.